This document outlines the methods to configure or change the Grafana interface language, based on user preferences, and Grafana's built-in internationalization (i18n) features.
Ways to Set or Change the Language in Grafana
-
Using Browser-Based Translation Extensions
-
Browser tools (e.g., Google Translate extension) can translate the Grafana UI on-the-fly.
-
-
Hardcoded Language in Dashboards.
-
This involves manually hardcoding translated titles, descriptions, and labels in specific languages during the time of dashboard creation.
-
-
Using EF Agent Desk's Built-in Translation API. Recommended
-
This allows dynamic rendering of dashboard elements (titles, descriptions, etc.) based on the user’s selected language on the Agent DEsk.
-
-
Grafana built-in language support.
⚠️ Grafana’s official language support is available from version 9.3 and above.
Our current grafana deployment (v9.1.6) does not support built-in i18n features.
See the Grafana Release notes for support of built-in language translation
Translated areas supported by Grafana's built-in Language Support.
-
Navigation and sidebar
-
Menu items: Dashboards, Explore, Alerts, Configuration, etc.
-
Tooltips and system buttons
-
-
Dashboard Interface
-
Common actions: Save, Share, Edit, Settings
-
Panel menus and header actions
-
Time picker and auto-refresh controls
-
-
User Preferences & Profile
-
Language selector option in user profile
-
Date/time format and theme settings
-
-
Settings Pages
-
Organization and user settings
-
Plugin installation/configuration screens
-
Team and role management
-
-
Alerts & Notification Channels
-
UI labels, status indicators, and configuration actions
-
-
Authentication UI
-
Login, registration, and password reset screens
-
Field labels and error messages
-
Grafana’s built-in language support (i18n) does not automatically translate panel titles, descriptions, units, or data labels. These elements are considered user-defined content, and must be managed manually.
List of Built-in languages supported in Grafana v10.3.2+
-
English
-
French
-
German
-
Spanish
-
Portuguese
-
Simplified Chinese
-
Traditional Chinese
-
Japanese
-
Korean
-
Russian
-
Turkish
-
Ukrainian
-
Polish
Procedure to implement language translation by using AgentDesks translation API.
This procedure outlines how to dynamically apply language translations in Grafana dashboards by leveraging the Agent Desk Translation API.
-
Add a Language Selection Variable in Grafana
-
Define a new dashboard constant variable ie
language_format_prefix.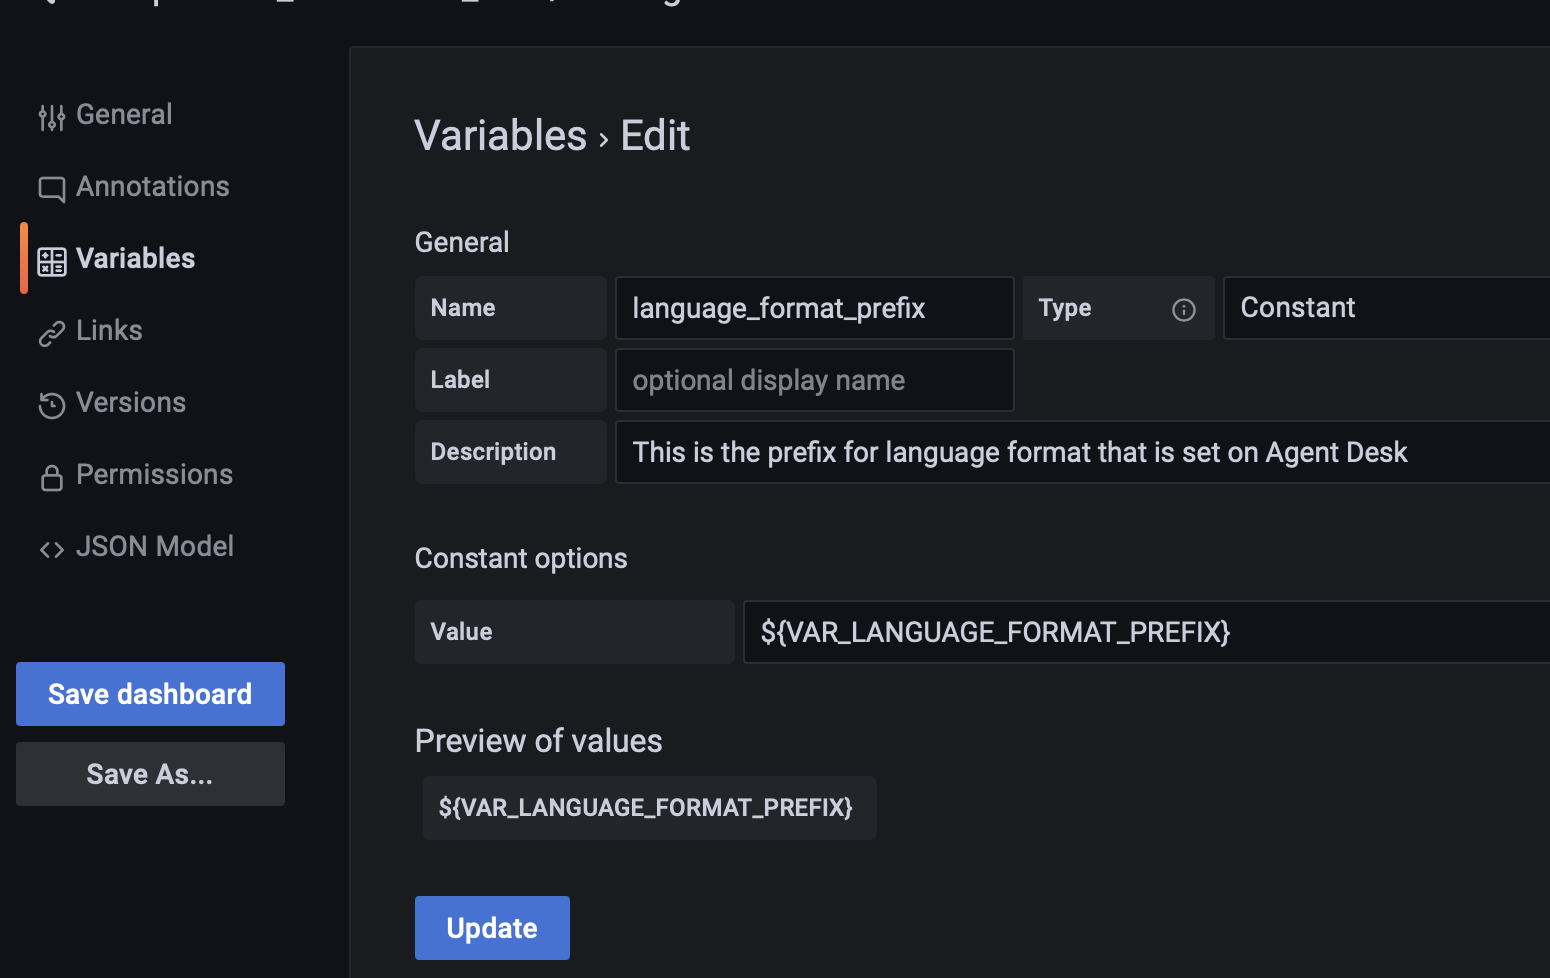
-
This variable will store the language code (e.g.,
en,ar,fr) passed from the Agent Desk when user switches to any language preference. -
It will be passed by the frontend to Grafana via Grafana’s embedded URL. eg
-
<GRAFANA_BASE_URL>&language_format_prefix=ar
-
-
-
Connect to the Translation API
-
Create a variable that will store the dynamic translated value.
-
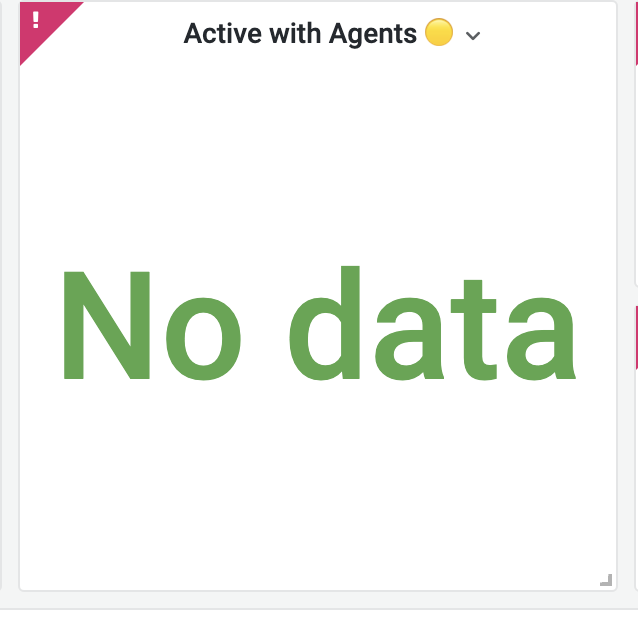
eg. For queue_summary_stats_panel_title you need to define a variable.
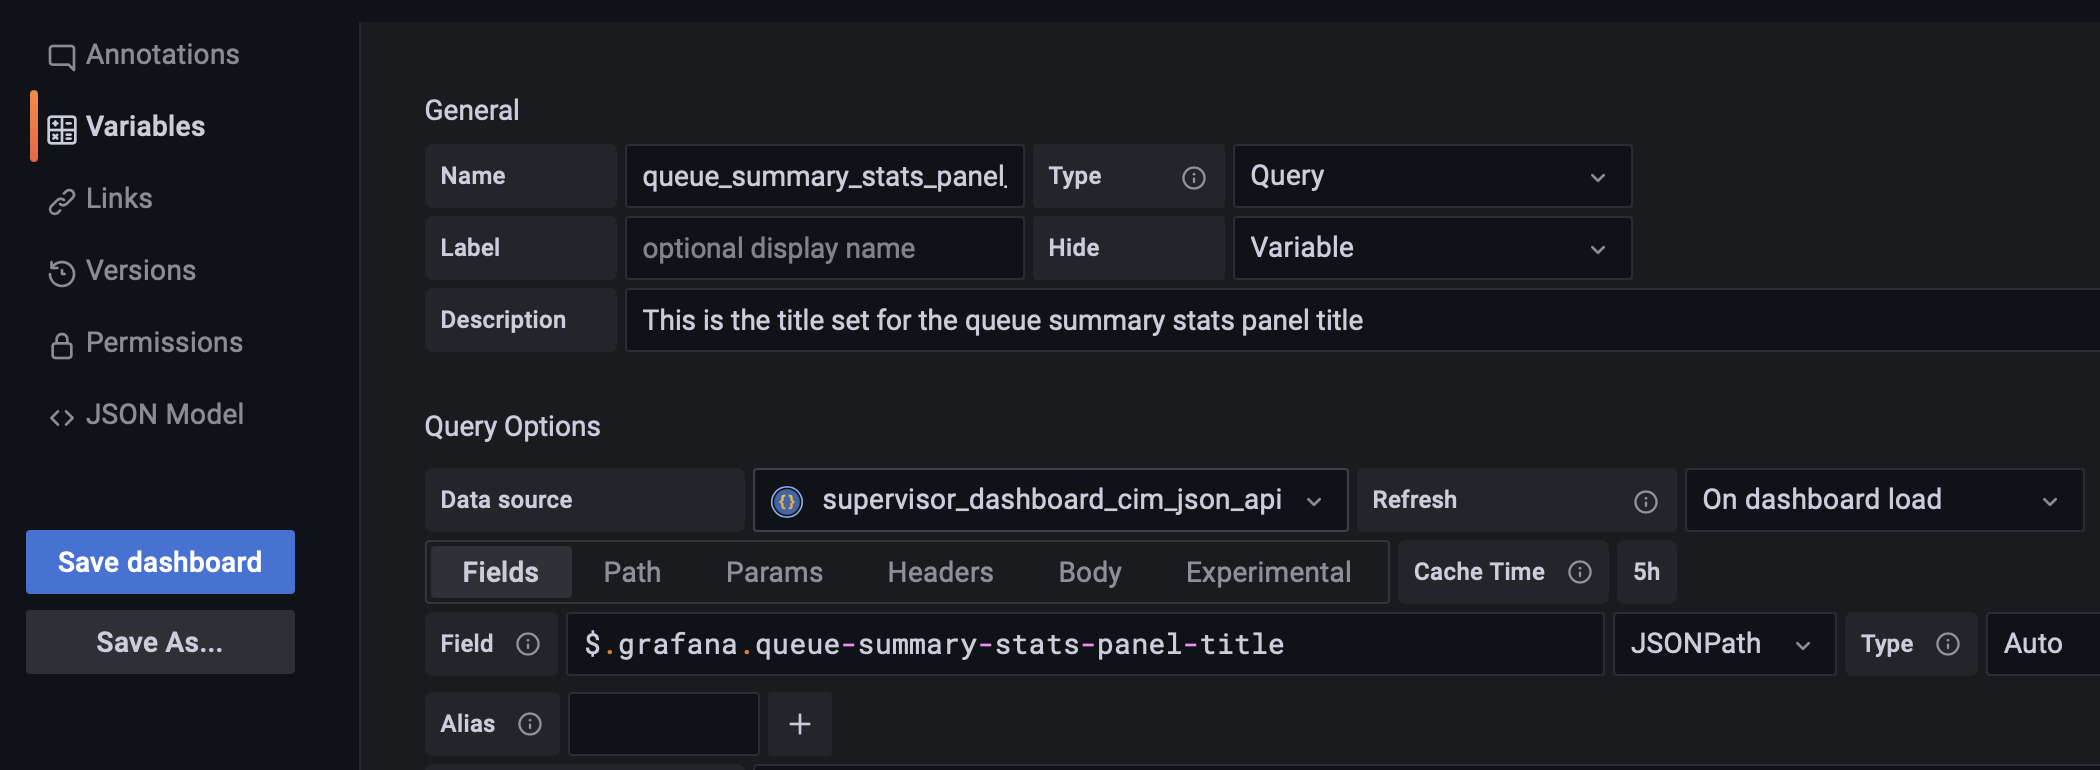
-
On the path , add API Endpoint to get the translated descripitions:
-
<FQDN>/assets/i18n/{language_format_prefix}.json -
Grafana will make a HTTP (Agent Desk Translation API) to fetch the translated info based on the language code passed to Grafana via embedded URL.
Example for Arabic. whenlanguage_format_prefixvariable is set toar -
<FQDN>/assets/i18n/ar.json
-
-
Based on the HTTP response, extract queue_summary_stats_panel_title response and store it in the variable defined at step(2a(i)).
-
Translation API Response Format for Arabic lang
-
JavaScript
{
  "queue_summary_stats_title": "نشط مع الوكلاء",
  "queue_summary_stats_description": "عنوان ملخص إحصائيات الطابور",
  "bot_stats_title": "عنوان إحصائيات الروبوت",
  "bot_stats_summary_description": "وصف ملخص إحصائيات الروبوت"
}
-
-
This will be the translated response and you can use the queue_summary_stats_panel_title in your panel to display the translated response.
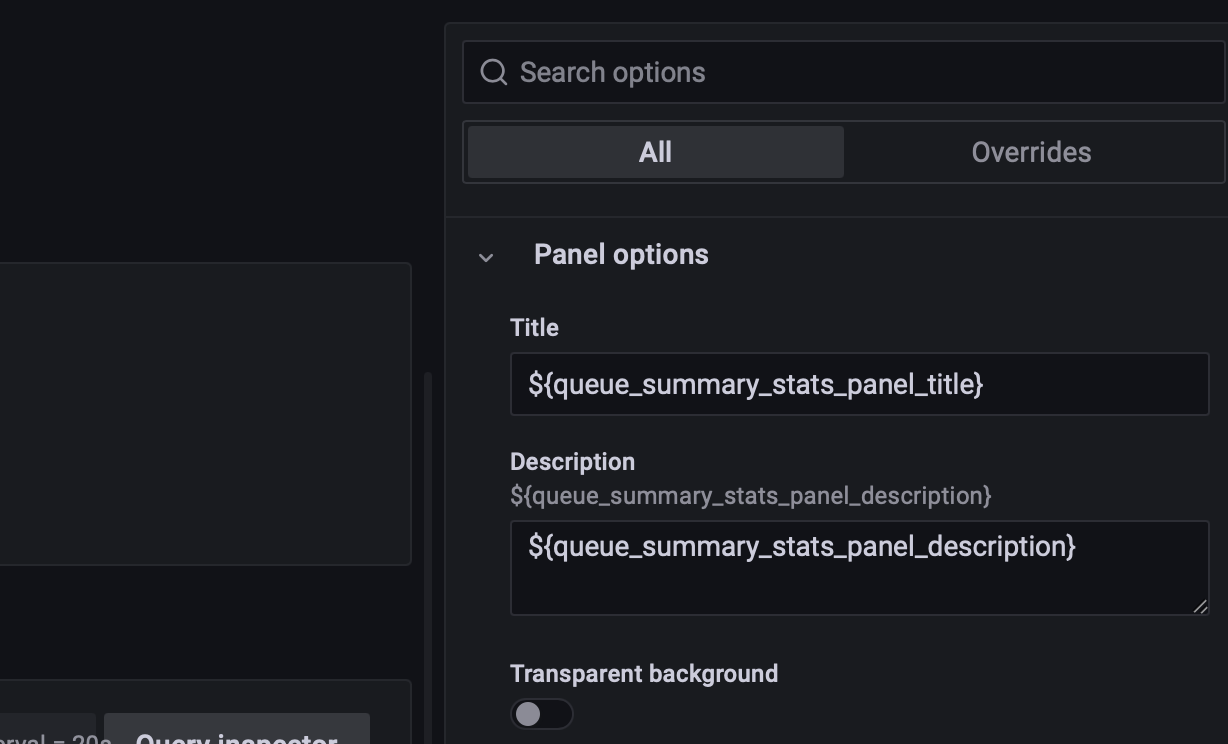
-
Use the translated variables from the response and set them to a dynamic variable, so Grafana will automatically replace the translated fields based on the translated value.
Example.
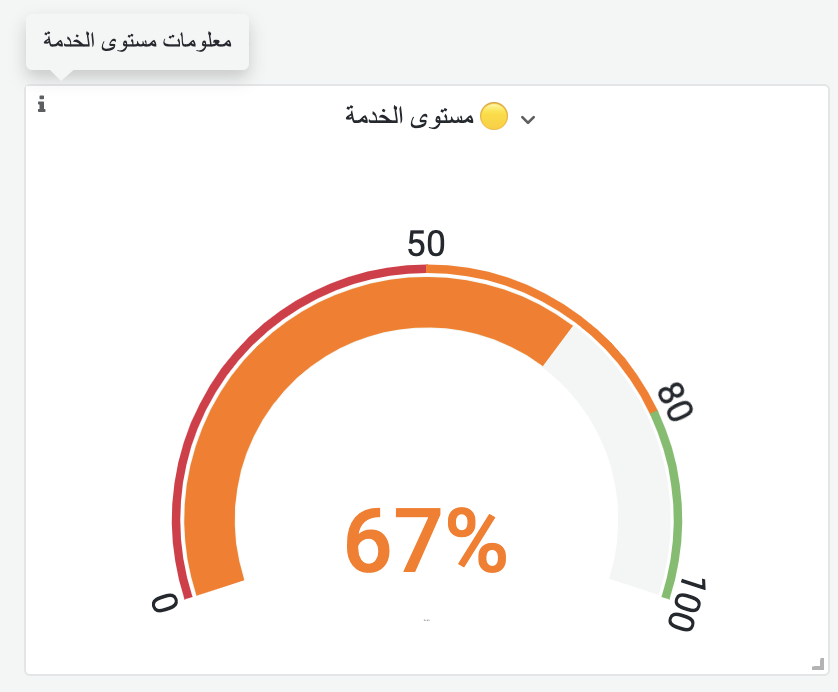
-
Limitations
With the implementation of using the i18n API exposed by the Agent Desk, there are some limitations to some content that we cannot translate on the grafana dashboard.
-
Dashboard folder name and file name
-
Dropdown variables label name
- Name / Label, are static text used for UI display in the dashboard variable. Only the value of the variable can be dynamicaly translated.
-
Error message from API
An alternative to solve this limitations is to rely on using browser extension for language translation