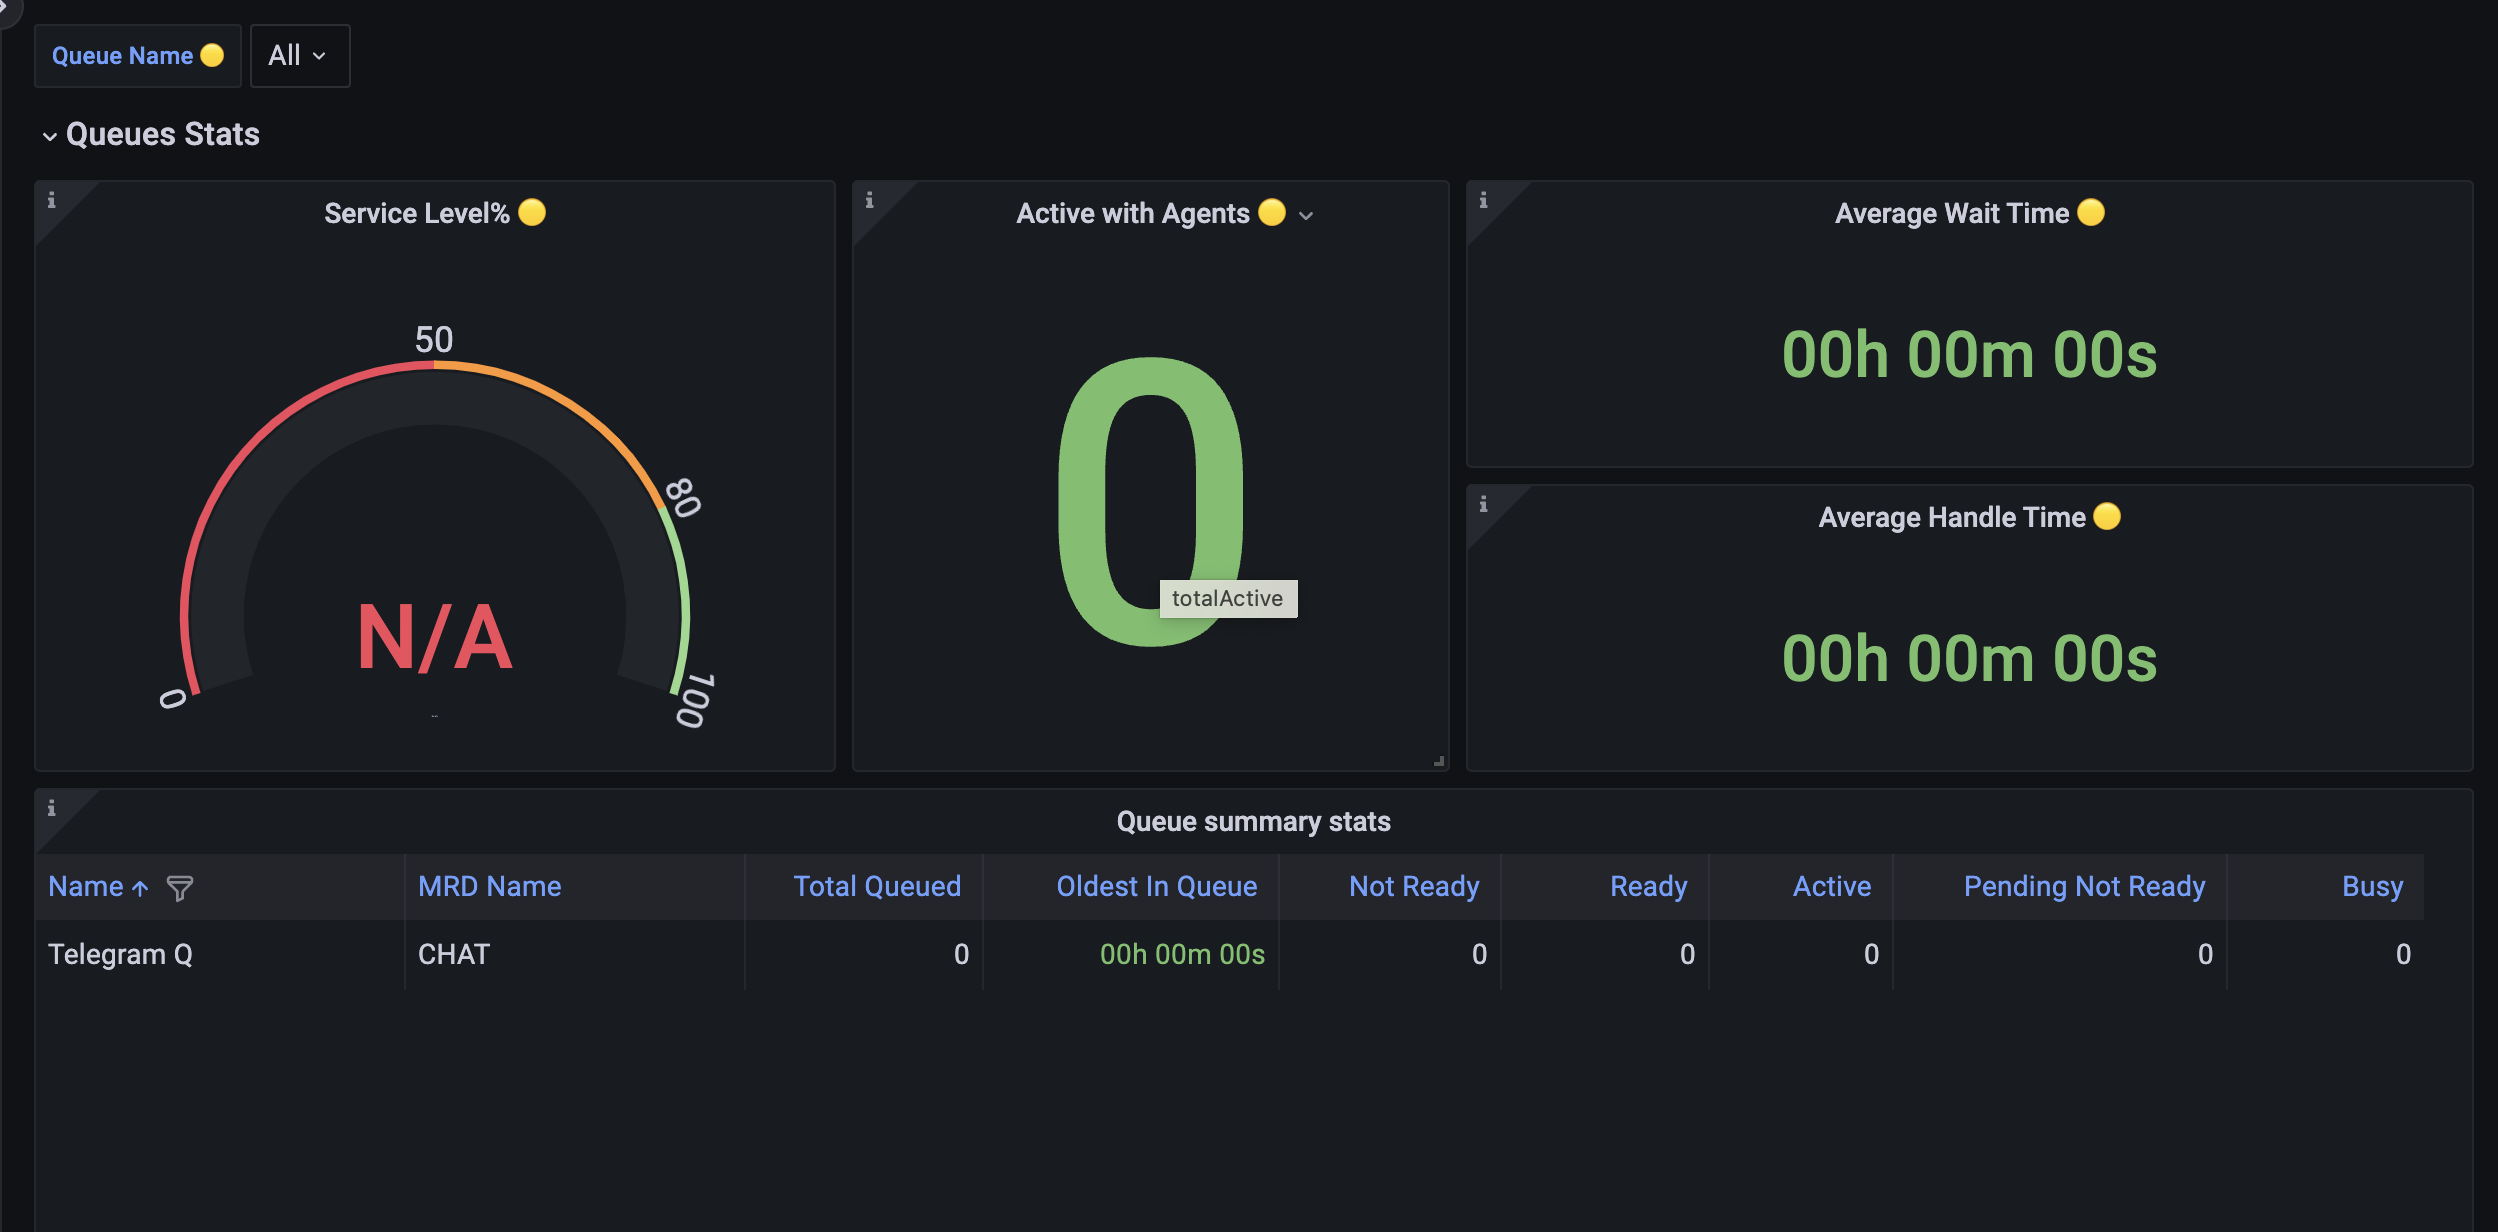
The dashboards embedded in Agent Desk are the real-time dashboards for agents to view the summary statistics of the contact center including queues, their states, and real-time conversations that are ongoing with agents and the bots.
There are two types of dashboards currently available for agents:
-
Summary Dashboards
-
Available Agents Detail
info
When agent login, it will be redirected to the summary dashboard if there is no ongoing conversation associated to that agent and there will be only two dashboards visible in the dashboard drop down menu including summary Dashboard and Active Agent Details.
Let’s know more about these dashboards:
Summary Dashboards
The Agents dashboard shows the summary statistics of all conversations being queued, for only the queues that the agents are part of. With the Agents dashboard implementation, the agents can now navigate through queues using the Queues filter dropdown. Based on the selected queue, they can monitor the queue statistics they are part of. They also have the capability of monitoring multi queues by selecting the queue(s) names from the queue filter.

Limitations
-
The saved filters (Teams, Queues) will be stored under the browser cache.
-
If "All Teams" is selected in the "Active Agents Detail" dashboard, this filter won't be applicable to the rest of the dashboards.
-
If the Teams filter is then changed in another dashboard, the same filter will also be applicable to "Active Agents Detail" dashboard.
-
If dashboards or saved filters get stuck after repeated refreshes, waiting for a few seconds and then refreshing again will resolve the issue.
Available Agents Detail
In the available agents detail dashboard, the agent will be able to view all the agent of his team who are currently available (active) including their state, no. of active conversations and state of subscribed MRDs. While viewing the list of available agents with a count of active conversations, supervisors can also change an agent's state based on the agent's current state. This allows supervisors to manage long-idle agents and maintains workflow efficiency.
The supervisor can only change the global state of the agent and not its MRD state.
To do so, supervisors click on the "Change State" dropdown against the desired agent whose state needs to be changed. The only available changes for the agent's global states are:
-
From Not Ready to Ready
-
From Not Ready to Log Out
To see the desired conversations on this dashboard, use the following filters:
-
Search Agent - This filter allows the supervisor to search for a specific agent of her team.
-
Team - Choose one team from the dropdown to see the active agent's details and the current state of agents in each MRD.

The following details are available on the dashboard.
|
Field |
Description |
|---|---|
|
Agent (s) |
shows the name of an agent along with the current state Ready, Not Ready |
|
State |
shows the state of the agent. |
|
Active Conversation |
shows the number of active conversations going on with the agent for the selected queue. |
|
MRD State |
displays the current state of the agent in a particular MRD Colored circles on the upper right corner of the dashboard represent the MRD states. For more details of MRD State Transitions see < Agent State -> Change MRD States |
Limitations
-
Adding or removing agents from a team in Keycloak will take effect upon the agent's next login, not in real-time on dashboards.
-
If a supervisor is also an agent, he’ll only be able to view and see the teams in the dashboard that he supervises and not the team in which he is added as an agent.
Agents can also access this dashboard. When logged in as an agent, they can only view their own team states only.