Requirements
For logs retention on a kubernetes cluster, below given Hardware specs are required for the solution. Please consult official documentation for the cluster size.
|
Entity |
Specification |
|---|---|
|
vCPU |
4 minimum, 8 recommended |
|
RAM |
8 minimum, 16 GB recommended |
|
Disk |
between 150GB to 250GB for a mid-ranged deployment aggregation. 500GB + for larger deployments |
This guide is a follow up on the logs aggregation using logging-operator as prerequisite of Deployment of Logging Operator
Add the charts repository
helm repo add expertflow https://expertflow.github.io/charts
update the repository
helm repo update expertflow
clone the values file and update the parameters
mkdir helm-values
Create namespace for ELK Stack depoyment
kubectl create namespace elasticsearch
clone the values file for elasticsearch
helm show values expertflow/elasticsearch > helm-values/logging-elasticsearch-values.yaml
and edit/update these parameters to required values.
-
global
-
ingressRouter ( pointing to a valid FQDN )
-
-
security
-
elasticPassword ( Default password is set to
elastic123)
-
Optional Feature for heavier workloads
By default the elasticsearch helm chart is configured to run only master node, with all the roles i-e data, coordinating, ingest, which is sufficient for normal workloads. However, for heavier workloads, these options should be enabled in the helm chart’s values.yaml file and logs aggregation should be routed to ingest service using ingest.service.nodePort
Ingress Controller Selection
-
Default ingressClass is set to “nginx” in all helm charts' global section. if you prefer to use other ingress controller, please update the ingressClassName to appropriate value.
-
All helm charts served at expertflow helm repository ( CX groups/components and external components ) by default are compatible with ingress-nginx ingress controller using ingress-nginx annotations. Should there be requirement for any other ingress controller like traefik, HA-Proxy or contour etc, please adjust the annotations for all components accordingly. A coordinated guide for using Traefik as Ingress Controller is available for CX solution’s compatibility at Using Traefik as Ingress Controller
Add TLS Certificates in elasticsearch namespace by following any of the below methods
-
For Self Signed please use this guide Create self-signed certificates for ingress
-
For Commercial Certificates, please import them as
tls.crtandtls.keyand create secret with the name ofef-ingress-tls-secretin both ef-external and expertflow namespaces -
For LetsEncrypt(LE) based TLS Certificates please consult guide LetsEncrypt SSL for EF-CX
NOTE:
When using LE based TLS Certificates, you will have to enable correct annotations in all the relevant values file. For example, for CX, after downloading the custom-values.yaml file, you can run
sed -i -e 's/#cert-manager.io\/cluster-issuer: /cert-manager.io\/cluster-issuer: /g' helm-values/logging-elasticsearch-values.yamlcustom-values.yaml to enable it.
Deploy the Elasticsearch stack
helm upgrade --install --namespace elasticsearch --create-namespace --values helm-values/logging-elasticsearch-values.yaml elasticsearch expertflow/elasticsearch
It may take from 10 to 20 minutes for the complete solution to be ready. Please wait unless all the deployments are in ready state.
Log in into Kibana on browser using the following link and username password:-
link: https://<FQDN>/ef-kibana/
username: elastic
password: <PASSWORD_SET_IN_VALUES.YAML>
Network Connectivity
By default, elasticsearch is configured to listen on below given ports
|
port |
type |
Usage |
|---|---|---|
|
30920 for restAPI |
nodePort |
for ingest the documents externally |
|
30930 for transport |
nodePort |
|
Administration
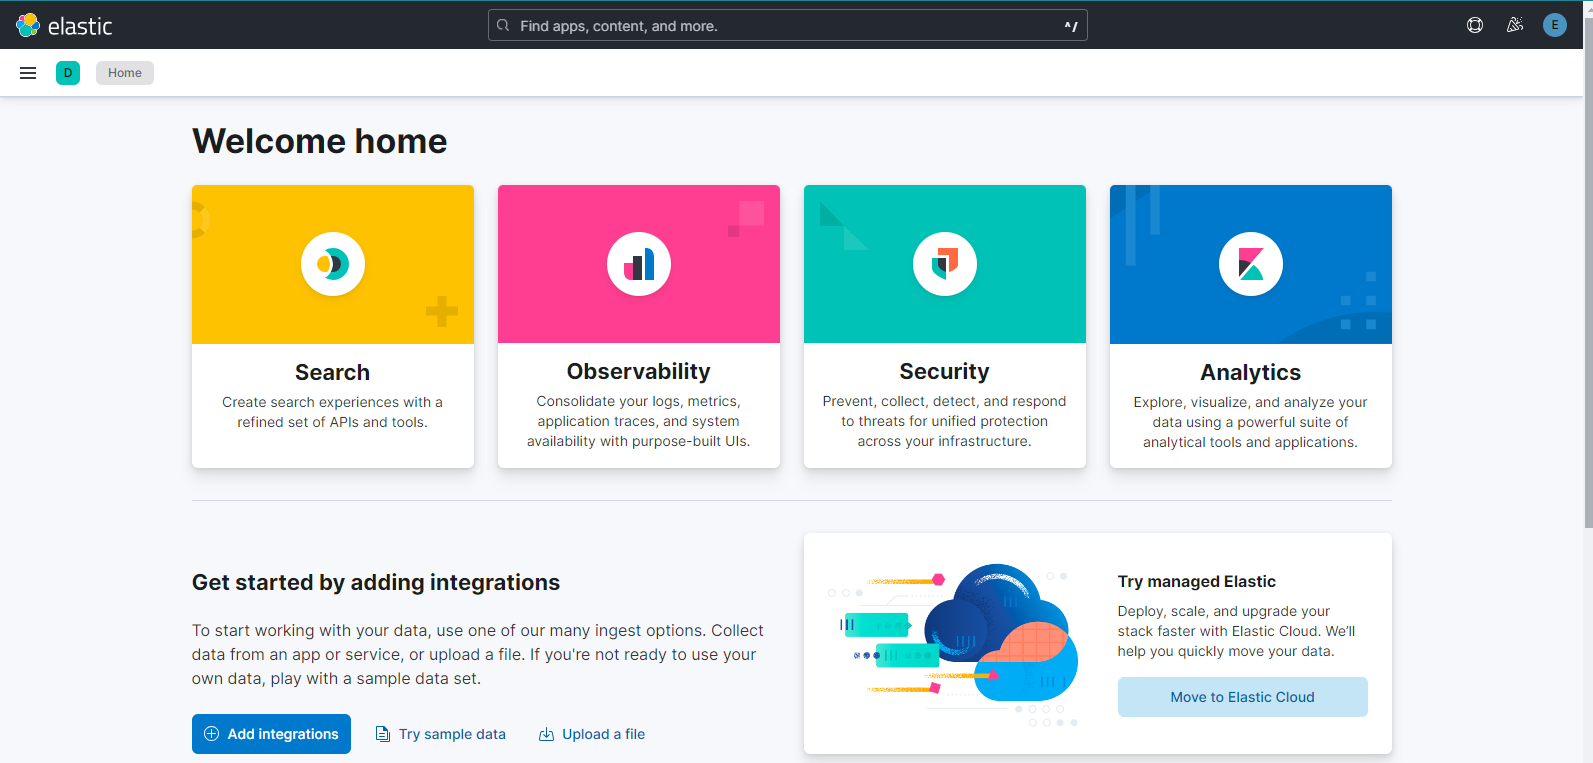
Once logged in into Kibana, Select “Explore on my own“ and proceed. UI will look like this:-
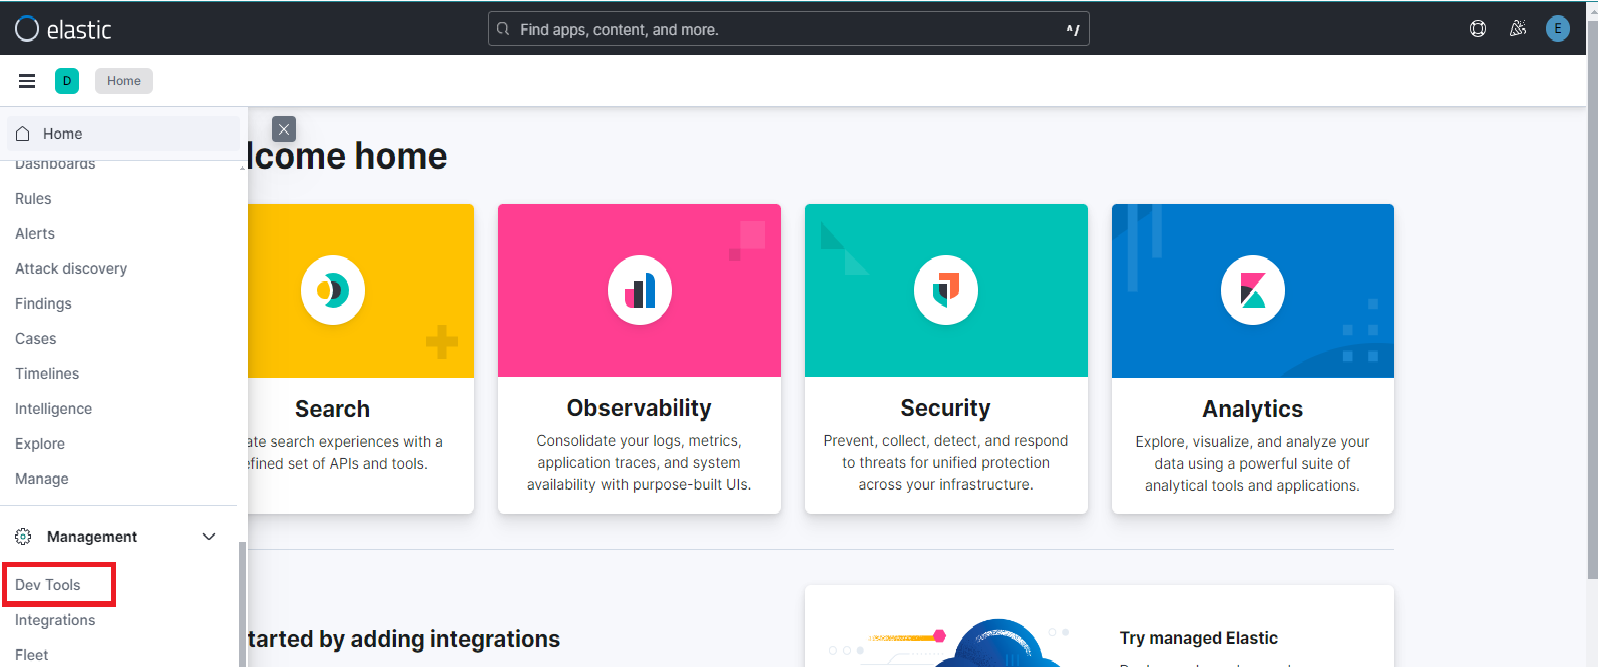
click on the burger button on the top left to open the left panel. scroll down to Dev Tools under Management section as shown below:-
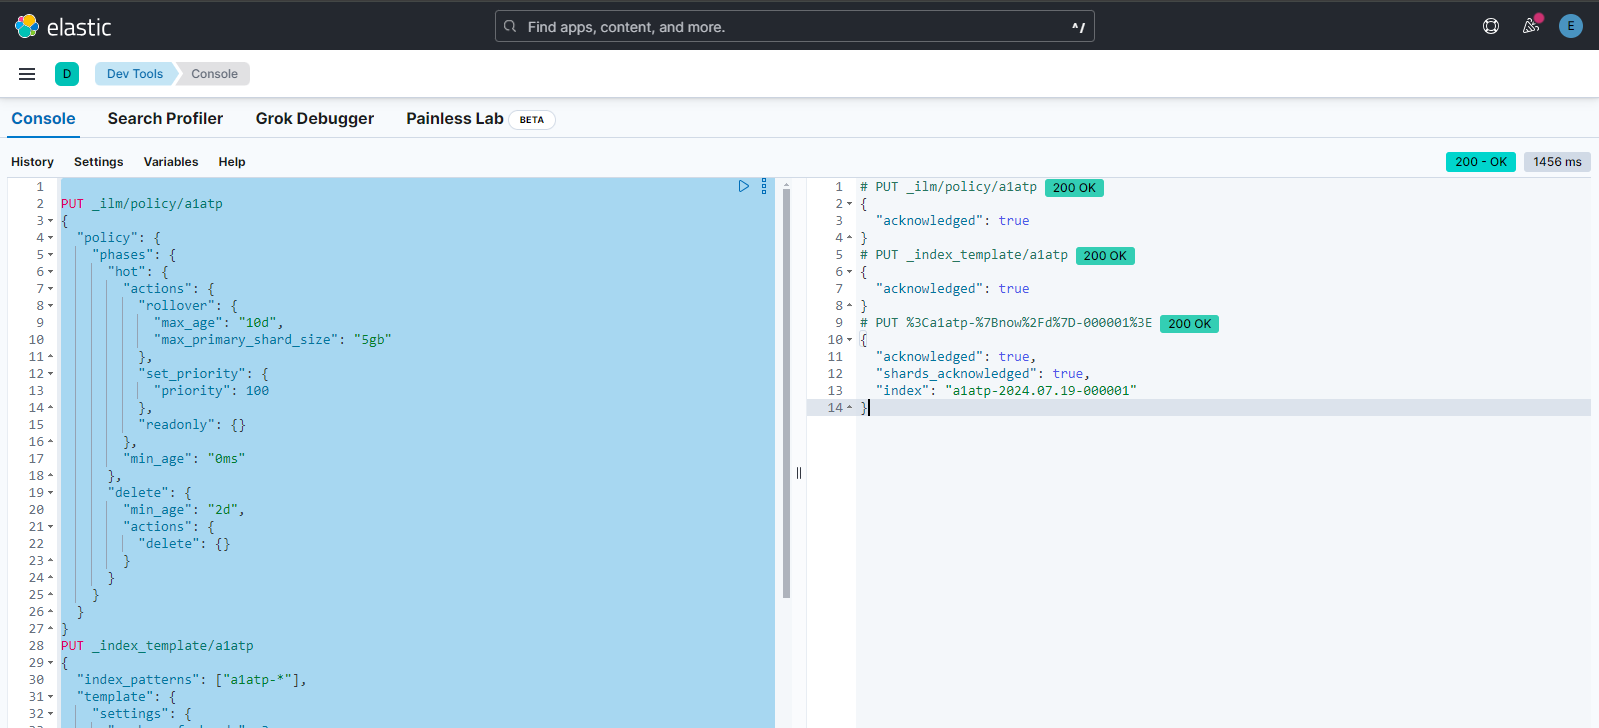
once inside the DEV tools, open the console and paste the following content. Please update before proceeding
-
replace <
index-alias> with the <INDEX_NAME> values while setting up the logging-operator’s namespace'd output resources. Repeat this step for all the indexes created. -
retention period for logs. default is set to either 8 days or 5Gb of primary Shard size holding the ingested logs whichever comes first.
PUT _ilm/policy/<index-alias>
{
  "policy": {
    "phases": {
      "hot": {
        "actions": {
          "rollover": {
            "max_age": "8d",
            "max_primary_shard_size": "5gb"
          },
          "set_priority": {
            "priority": 100
          }
        },
        "min_age": "0ms"
      },
      "delete": {
        "min_age": "1d",
        "actions": {
          "delete": {}
        }
      }
    }
  }
}

PUT _index_template/<index-alias>
{
  "index_patterns": ["<index-alias>-*"],
  "template": {
    "settings": {
      "number_of_shards": 3,
      "number_of_replicas": 1,
      "index.lifecycle.name": "<index-alias>",
      "index.lifecycle.rollover_alias": "<index-alias>"
    }
  }
}


# PUT <my-index-{now/d}-000001>
PUT %3C<index-alias>-%7Bnow%2Fd%7D-000001%3E
{
  "aliases": {
    "<index-alias>": {
      "is_write_index": true
    }
  }
}
after pasting the content, select all of this content and start running this code. The result will be as shown below:-
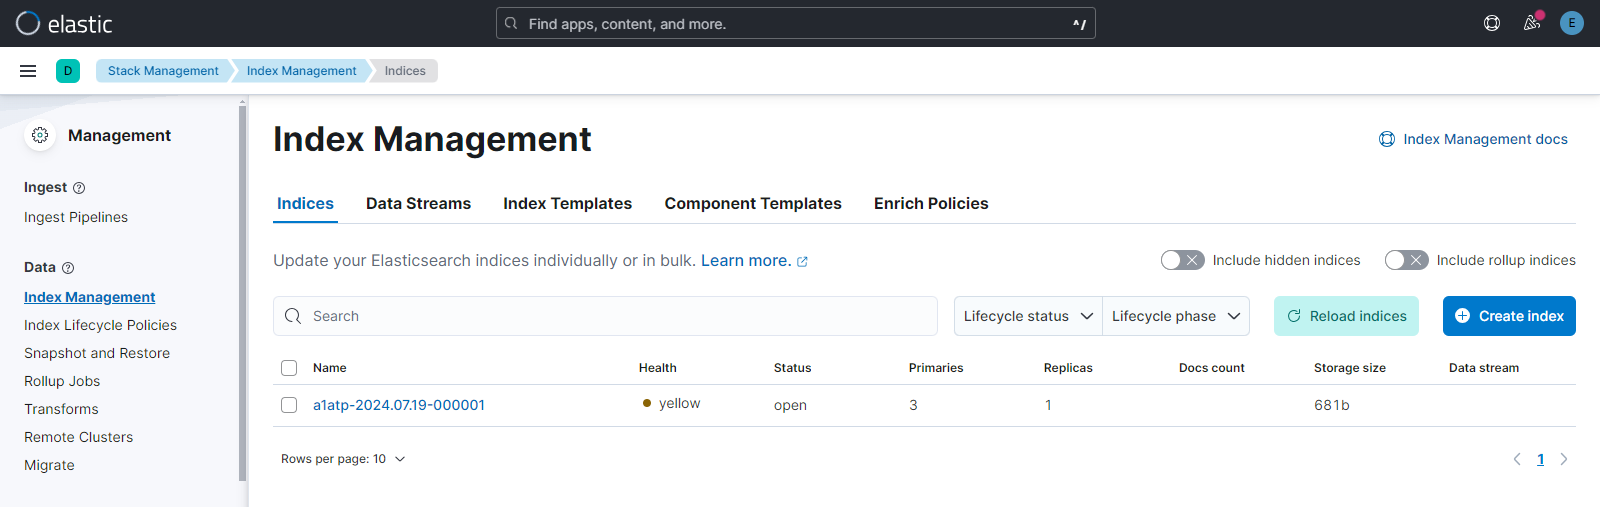
Head over to Stack Management from the burger menu and open Index Management. There you will see the index that you have created in Step 5. Output will be as below:-
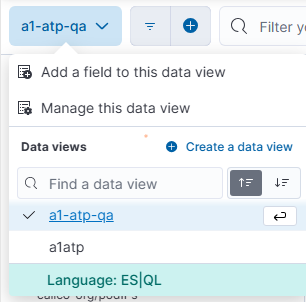
Create a Data view with the Index name and Index pattern and wait until Timestamp field is activated.
the logs for selected index start showing up in the kibana view panel.
For setting up logs aggregation, please refer to Deployment of Logging Operator