Pre-requisite
-
Make sure you have deployed the data platform as per https://expertflow-docs.atlassian.net/wiki/spaces/CX/pages/1291878417/EF+Data+Platform+Deployment+4.4.10+to+4.10?atlOrigin=eyJpIjoiMzcyNGY4NzM2ZmJjNDc2ZThkYTg0ZWYxNDRjZTdmOGIiLCJwIjoiYyJ9
-
Make sure you have the dedicated configured
data_migration_config.yaml
How to Proceed
For batch processing
To identify either the pipeline is configured batch or non-batch process, review the data_migration_config.yaml
To see the logs of pipeline run, review point 8
-
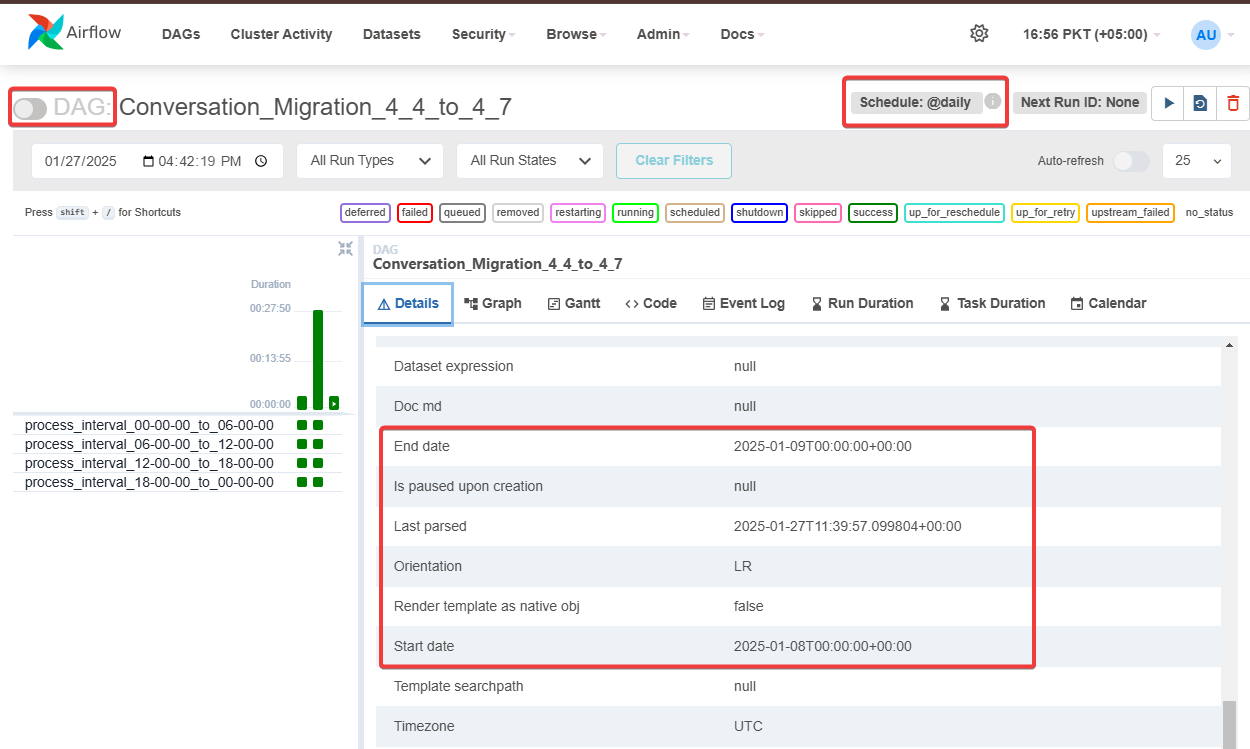
On Data Platform UI, within the Conversation_Manager_Batch_Migration_4.10 -> Details, you should see the start and end date as set within the config from Figure 1, in the bottom. Make sure the pipeline is paused initially
-
If there are existing pipeline runs available (Green bars, to the right of figure 1.) and this is your first time running the pipeline after adjusting the configuration, then
-
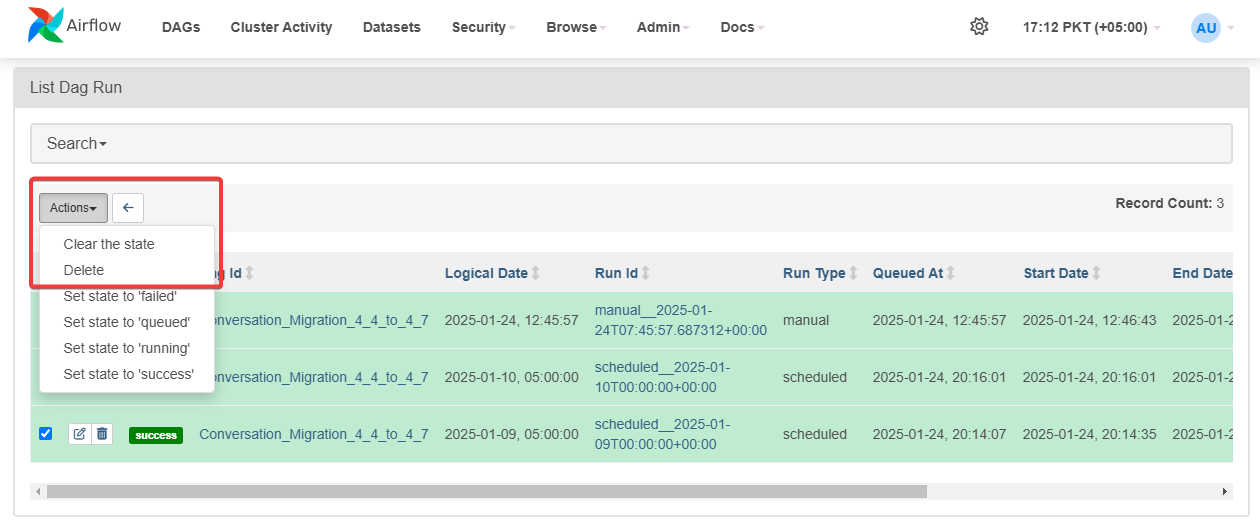
Click on Schedule (Refer to Figure 1), you will see all the instances ran, select all of them and delete from actions button (Refer to Figure 2.)
-
-
Go back to the Conversation_Manager_Batch_Migration_4.10 pipeline, now you will see there will be no runs available (green bars) and the next RUN ID (next to the schedule in figure 1.) is set to the
start_dateas configured in the yaml file (Logout and login again to get the latest changes) -
Switch to Graph, next to Details tab (Refer to figure 1.) to see the graphical view, this will show you the interval wise task as set within the config file
-
Resume the pipeline and turn on Auto-refresh slider, you will see the tasks running in the graphical view section. Make sure to turn on the Auto-refresh to keep seeing the most recent state.
-
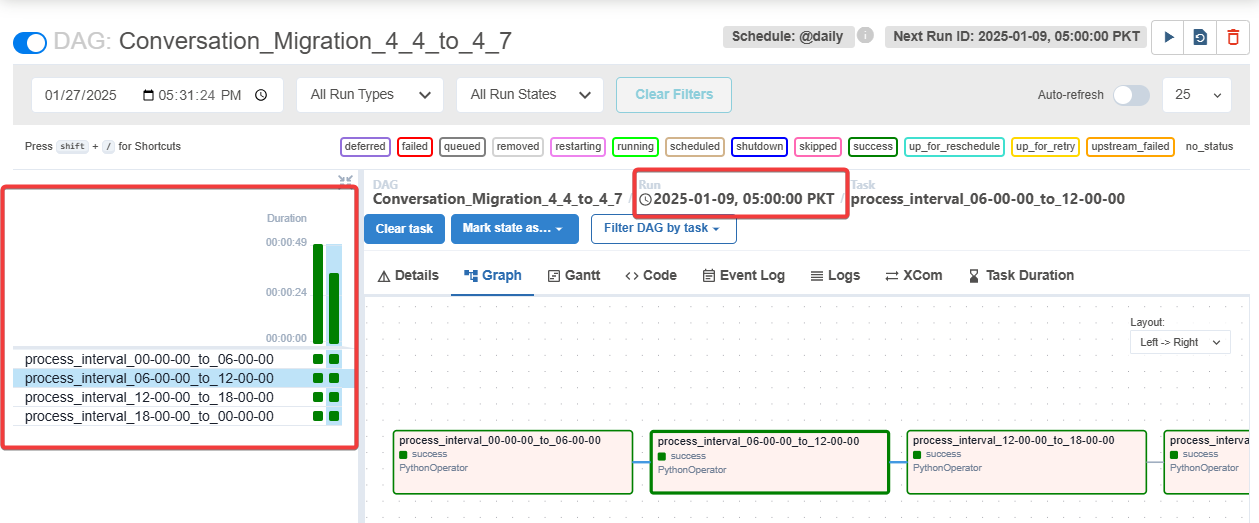
As the pipeline runs, there are few things that need to be observed (Refer to Figure 3.)
-
pipeline instance: To check whether the task instance of the specific date has run successfully (Left green bars), the square boxes highlight the task of that interval and vertical bar highlights the overall state of that pipeline instance of that date
-
Run Date: The date on which pipeline instance has been launched and completed.
-
For non-batch processing pipelines
-
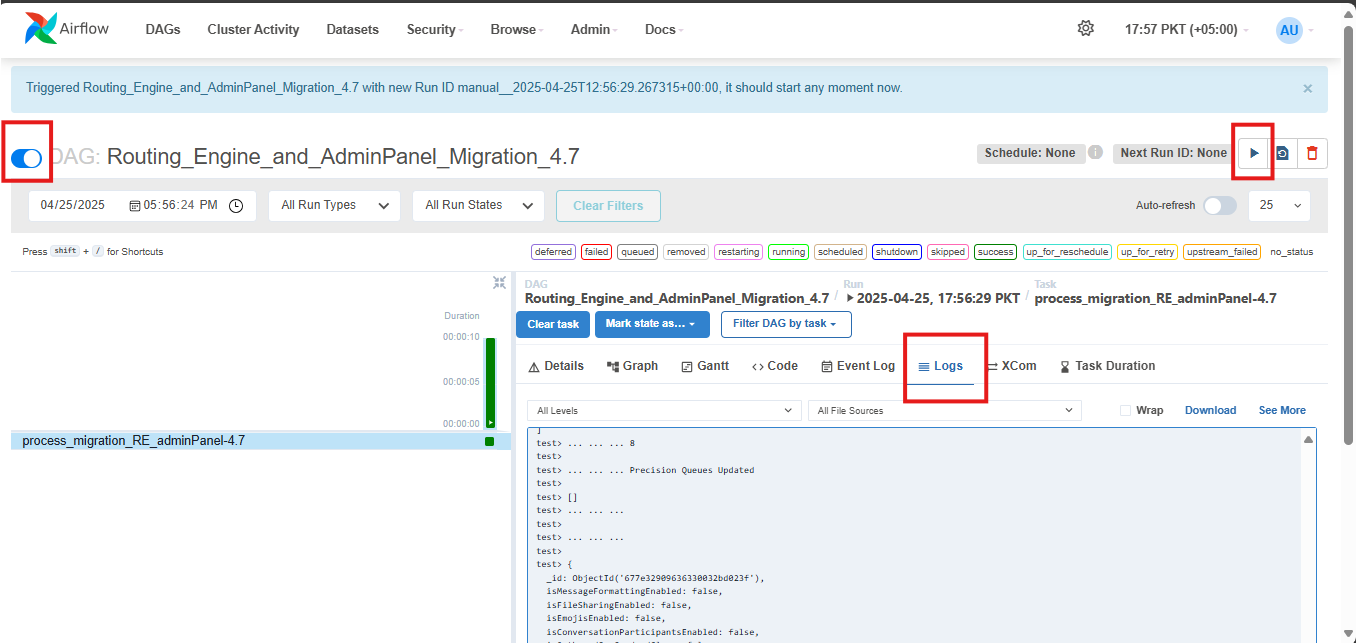
The non-batch pipelines have no batching in place, as it is designed for only one time run. Therefore, you just need to un-pause the pipeline named Routing_Engine_non_Batch_Migration_4.10 and trigger it. To see the logs of the pipeline run, click on the small green box and then select the logs tab (Refer to figure 4.)
Rollback Plan
-
If for some reason, the data didn’t come for a specific interval, (lets say from 06:00:00 to 12:00:00 of 2025-01-09). and we want to execute that interval again,
-
Click on the small green square (Refer to figure 3.) of that interval and select “Clear task”. This will open a new dialogue, select the “Recursive” option and then Clear (Refer to figure 4). This will clear up that task at that interval and queue it up for re-run
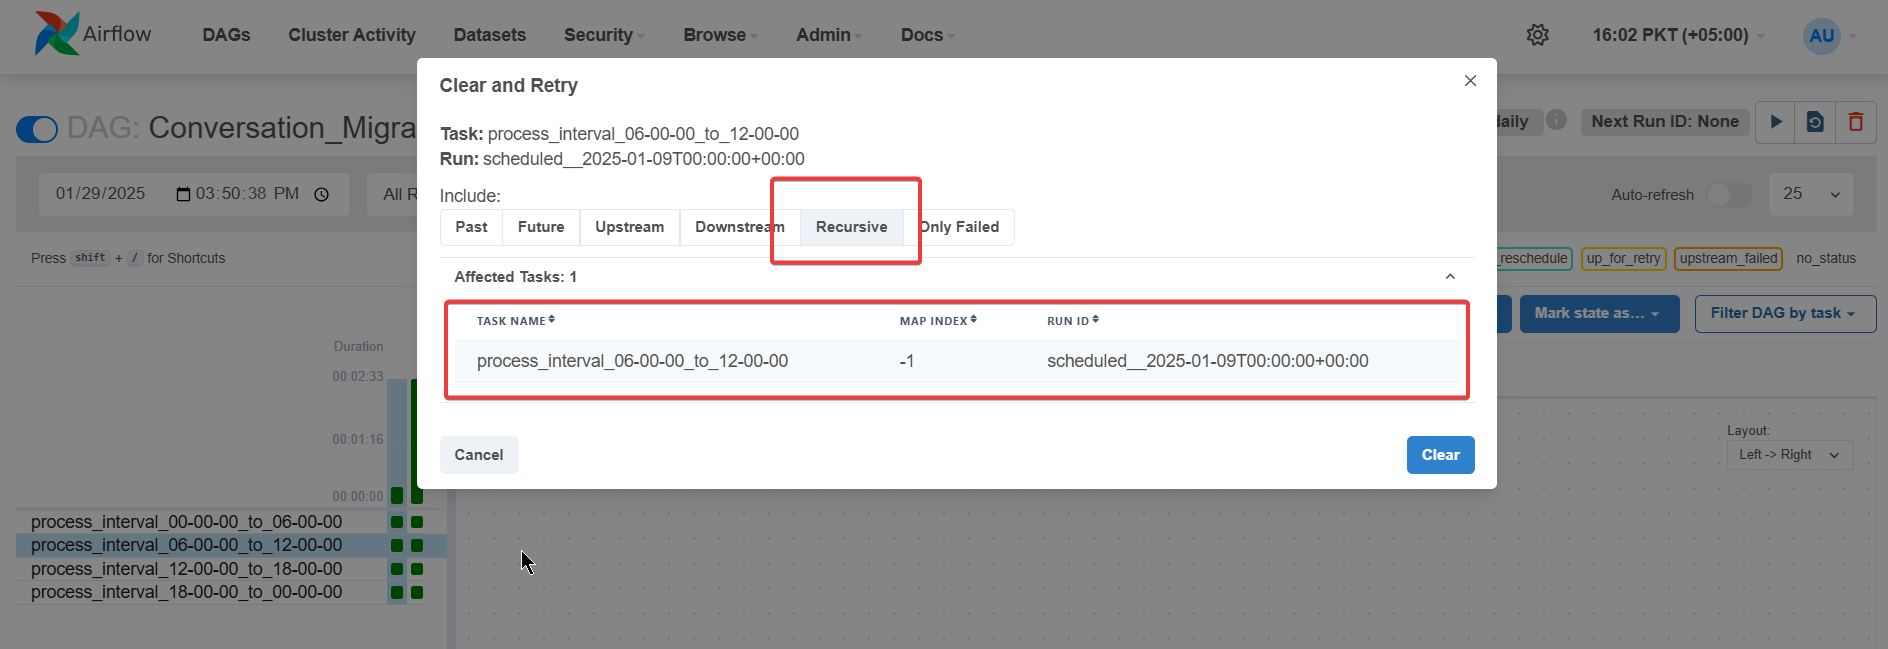
Figure 5. Highlighting the task re-run dialogue when Clear Task button is pressed
-
-
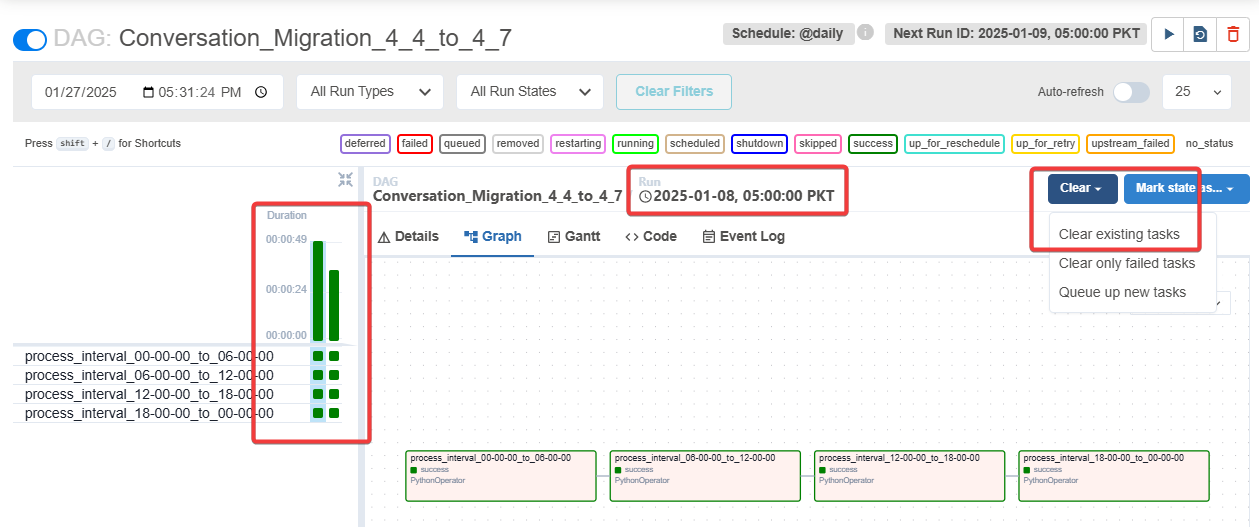
If we want to re-run for the entire day (lets say for 2025-01-08),
-
Click on the vertical bar at that time, then Clear → Clear existing tasks, this will re-run the entire instance on that date (Refer to figure 5.), refresh the tab if necessary.
-
-
It is recommended to pause the pipeline while clearing states to synchronize the schedule with the latest state.