The dashboards embedded in Agent Desk are the real-time dashboards for supervisors to view the summary statistics of the contact center including queues, agent states, and real-time conversations that are ongoing with agents and the bots.
Supervisors can monitor team-wise conversations.
-
A supervisor must have at least one team, for instance, Team Alpha
-
A supervisor must have at least one agent within her team. For instance, Agent-1 is a member of Team Alpha, which is supervised by Supervisor John.
-
Next, access the unified admin platform and assign agent attributes to Agent-1. This will establish a connection between Agent-1 and any available queue.
-
Then, log in as Agent-1 in the Agent Desk at least once. This will ensure that all the changes made to Agent-1 take effect.
-
Now, the supervisor can log in as Supervisor John and observe that the Team Alpha & the queue(s) associated with Team Alpha are visible on the dashboard / Grafana. This allows the supervisor to view the corresponding data.
There are two types of dashboards currently available:
-
Summary Dashboards - built within Grafana to display summarized stats of queues, agents, active conversations and MRDs
-
Detail Dashboards - built within Agent Desk for details about active/queued conversations, agent activities
Let's walk through the following to know more details.
Summary Dashboard
While logging in as a supervisor, the Summary Dashboard is the first screen supervisors will see. This dashboard shows the summary statistics of all conversations being queued, active with agents/bots and the overall agent states on the MRDs. With the new team-based implementation, supervisors can now see the Team filter that allows supervisors to switch between the teams to select the desired team. Based on the specified team, they can select multiple or single queue(s) to monitor the queue(s) statistics that are part of the supervisor's team.
To see the conversations on the dashboard, use the following filters in the sequence:
-
Bot Name - Choose the name of the bot from the dropdown
-
Team Name - Choose one team from the dropdown to see the associated queues. This allows supervisors to view the queues linked to the teams under their supervision.
-
Queue Name - Based on the Team's selection, the Queues dropdown populates the queue(s) associated with the specified Team. Once the queue(s) is selected, the data on the dashboard is filtered based on the selected queue(s).
-
MRD Name - Based on the Team's selection, choose one MRD to see the current MRD states of those agents that are part of the supervisor's team.
-
Adding or removing agent attributes that affect queue associations will take effect upon the agent's next login, not in real-time on dashboards.
Each different widget on this dashboard is termed a Panel in Grafana.
The dashboard contains three rows where related data is grouped under each row.
Those three rows are:
-
Queue Stats
-
Agent States
-
Bot Stats
See the following sections to learn more about the panels grouped under each row.
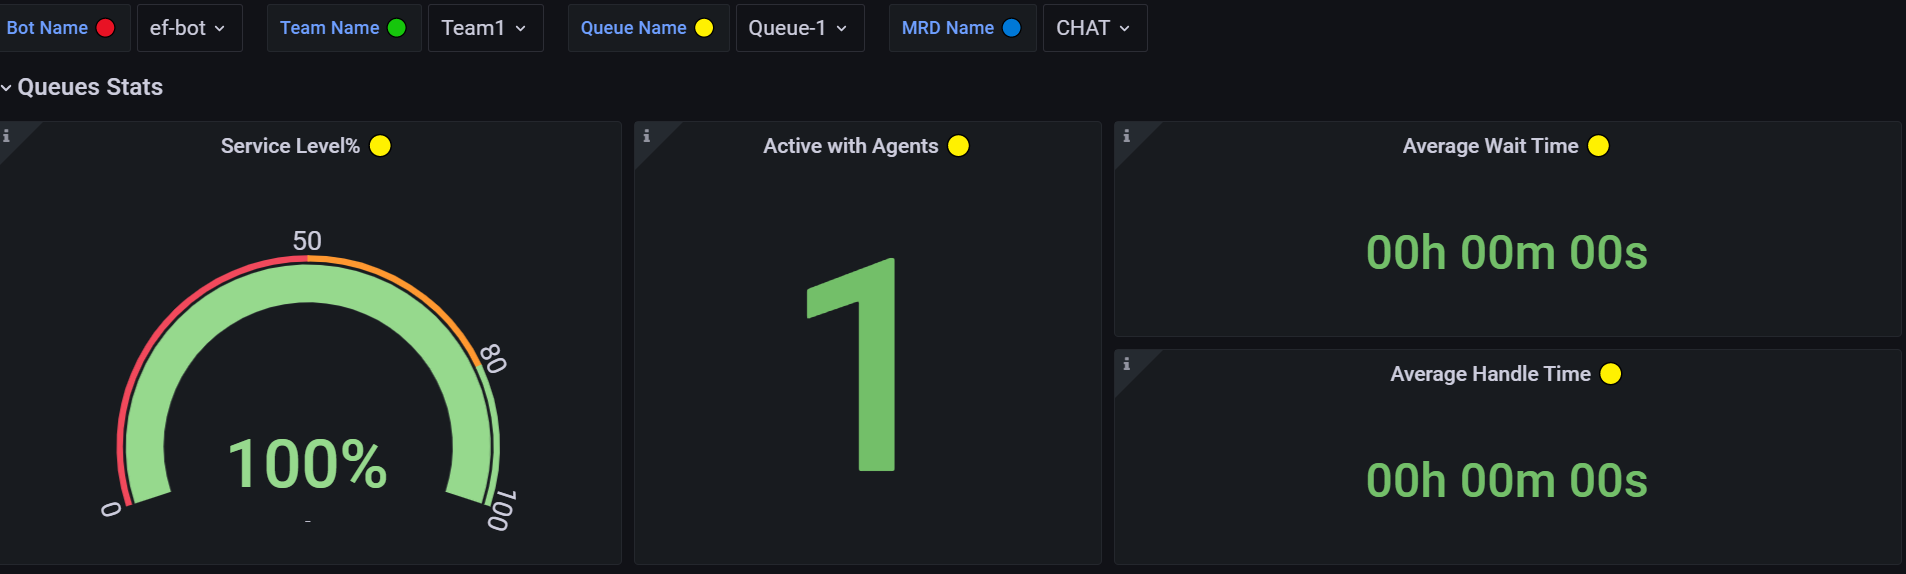
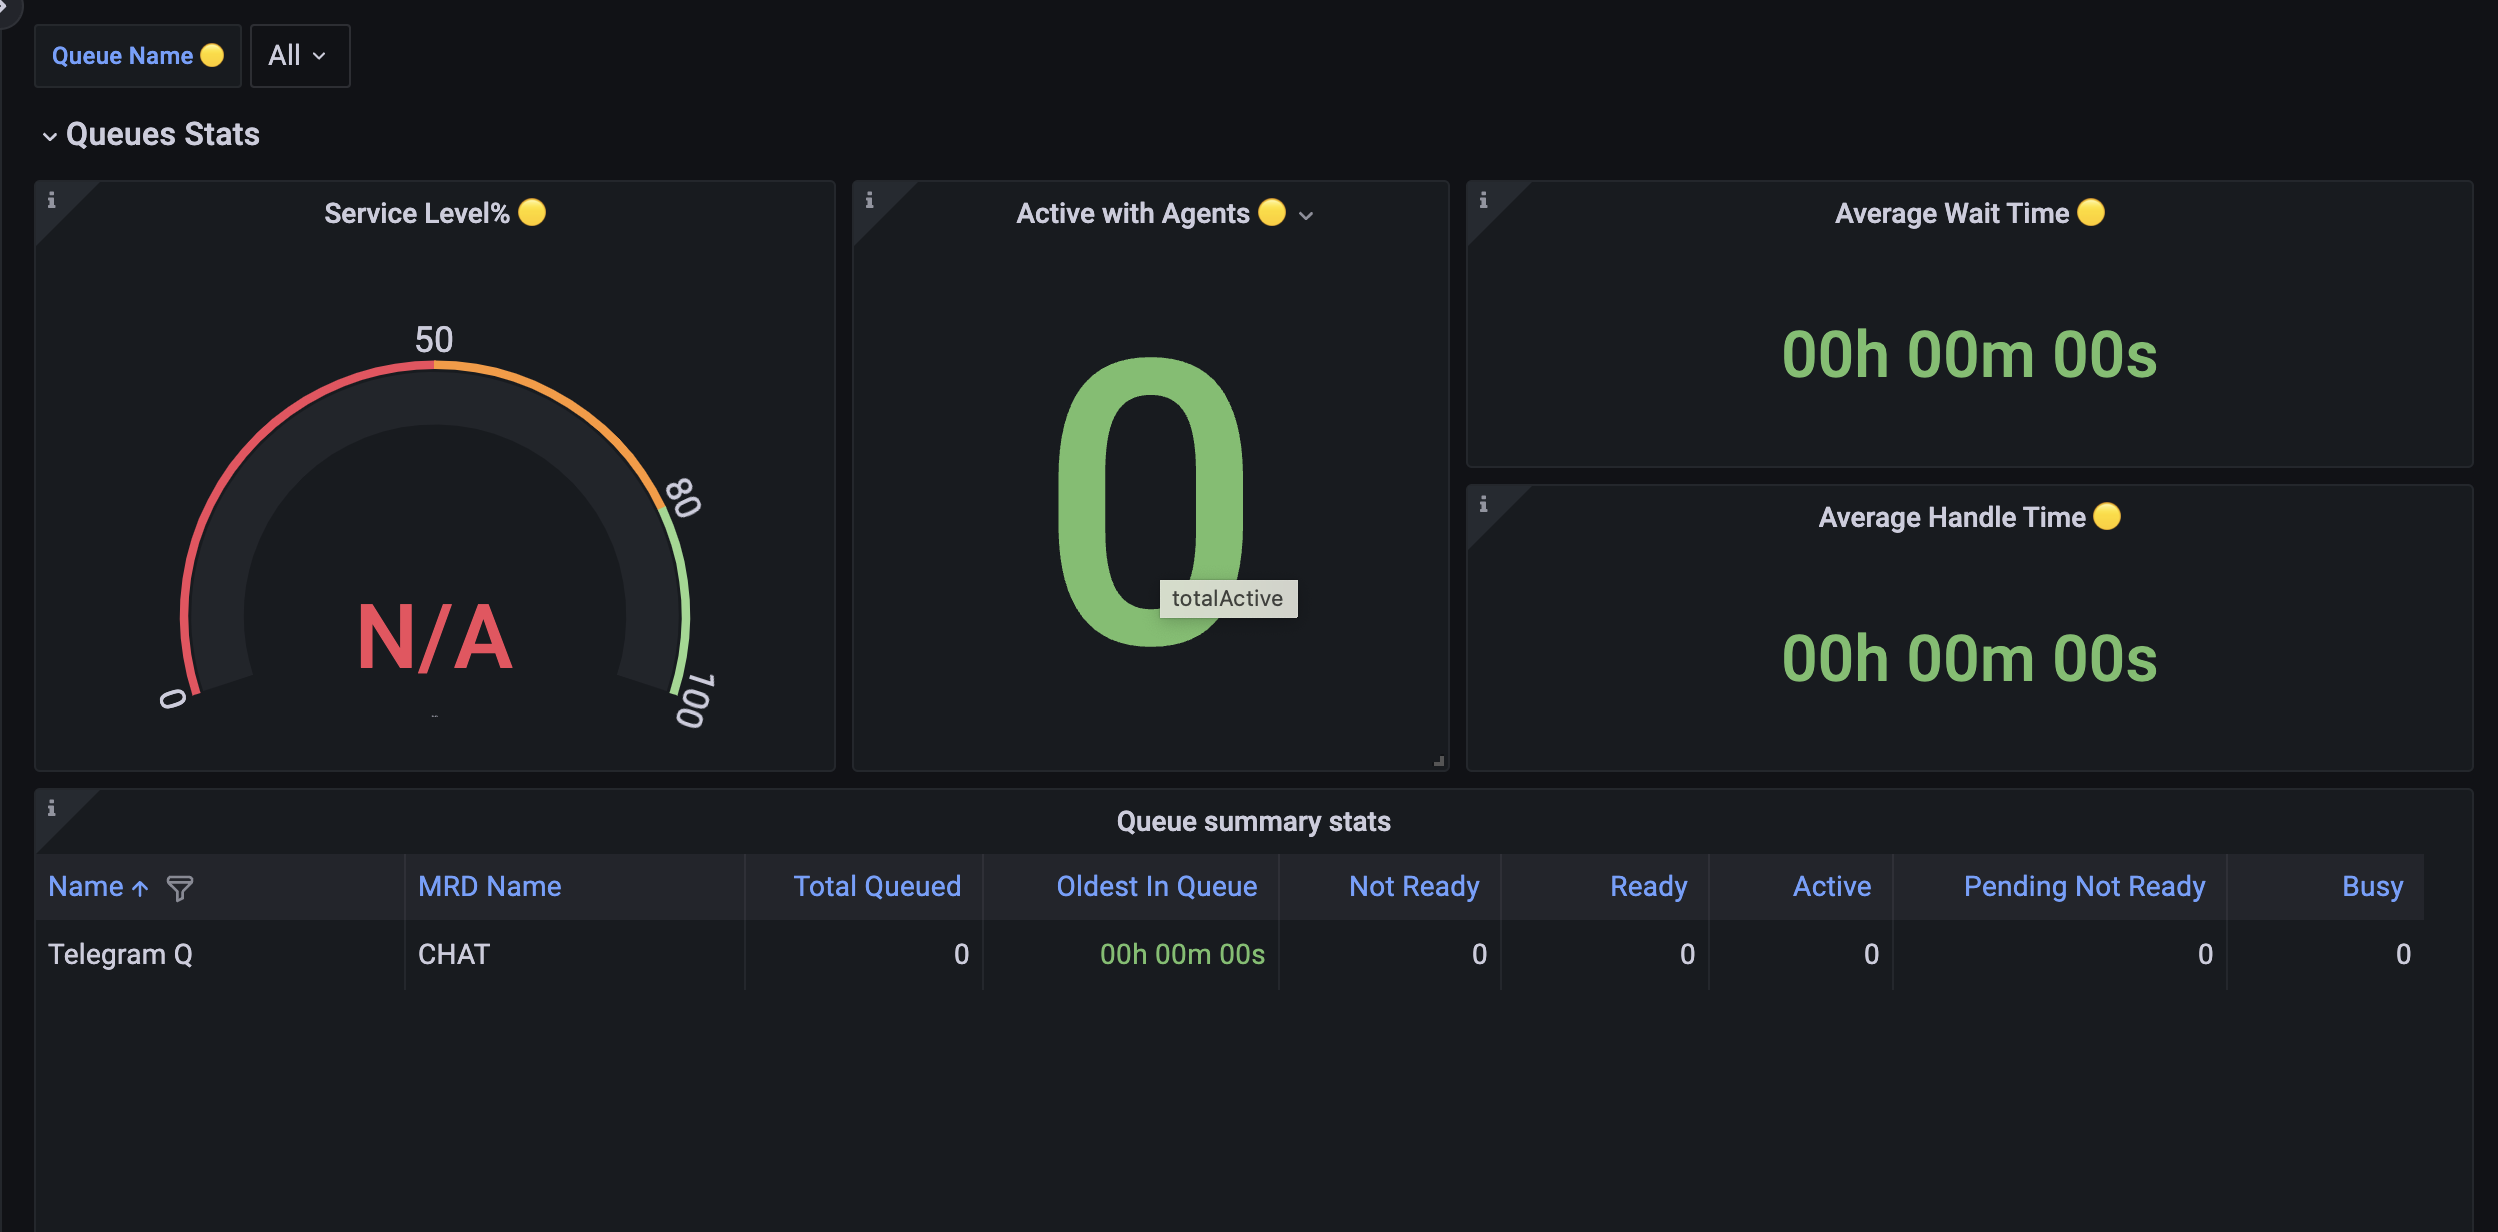
Queue Stats
On the Queues Stats dashboard, you can see the following information
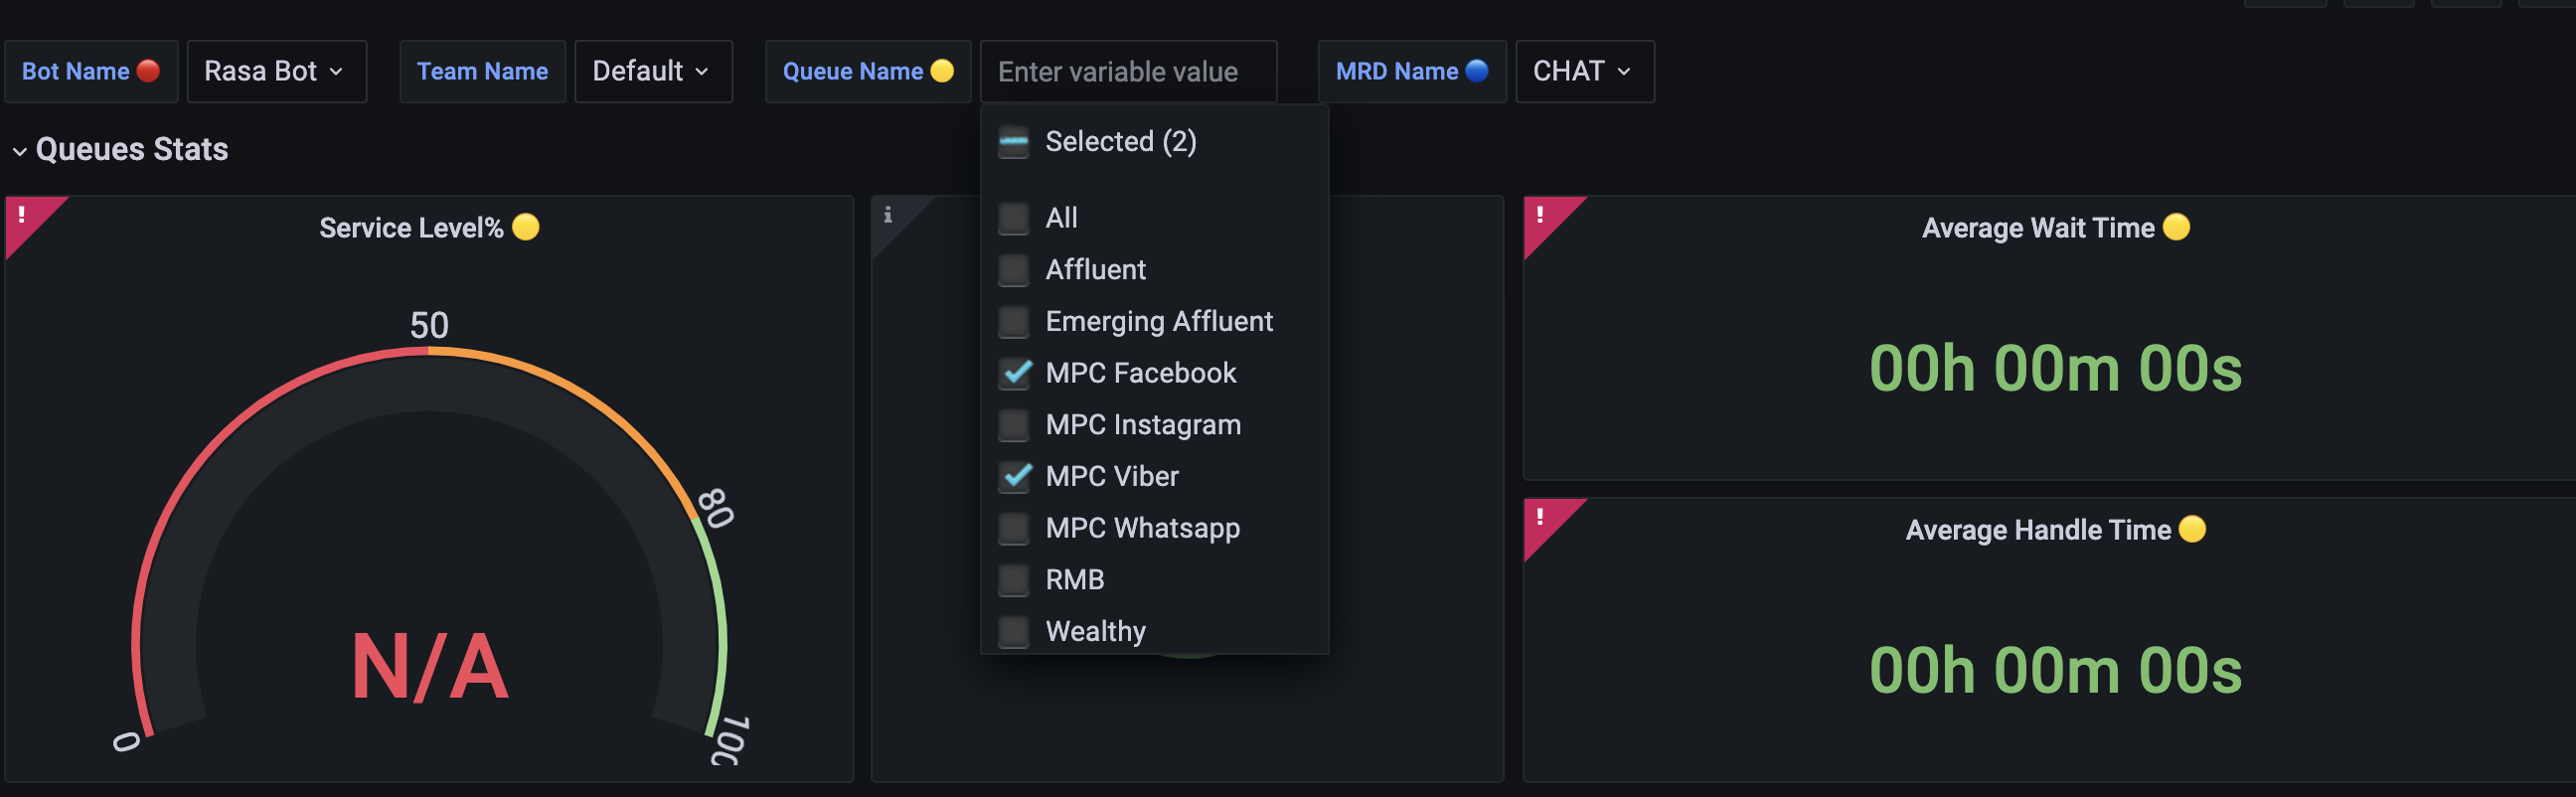
MultiQueue selection
On the Queue dropdown filter, the users have the capability of monitoring multi or single queue(s) statistics by selecting their desired queue(s) from the queue dropdown filter checkbox.
|
Panel |
Description |
|---|---|
|
Service Level% |
Shows the Service Level % of the queue(s) based on the Queues filter given on top of the dashboard. This data is retrieved from the historical database which is why, it gets updated after the historical reporting interval. The reporting interval is configurable. By default, it is set to 5 minutes. This is calculated based on the Service Level Type set in the queue definition by the administrator. See more on Reporting Database Schema -> Key Reporting Concepts to learn more about this parameter. |
Active with Agents
|
Shows a number of active conversations that are currently active with agents of the selected team. This data is currently filtered based on the queue(s) that is selected from the queue filter on top of the dashboard, showing the conversations of the queue(s) that are currently active with agents. |
|
Average Wait Time |
This is the time duration when the request remains in the queue. An average waiting time is calculated by summing all the waiting times and dividing them by the sum of all chats. If for the case when multiple queues are selected, the average wait time will be averaged based on the number of selected queues. Its format is hours minutes seconds (00h 00m 00s) |
|
Average Handle Time |
This determines the average handle time of all closed tasks regardless of any disposition This duration is calculated as: task_end_time - task_answered_time In case, a conversation is joined and handled by multiple agents, the conversation's total handled duration is a sum of the handle durations of all agent tasks (created for each agent who joined the conversation). The average handled duration is calculated as:
If for the case multiple queues are selected, the AHT will be calculated based on the average of the number of the selected queues. Format: hours minutes seconds (00h 00m 00s) |
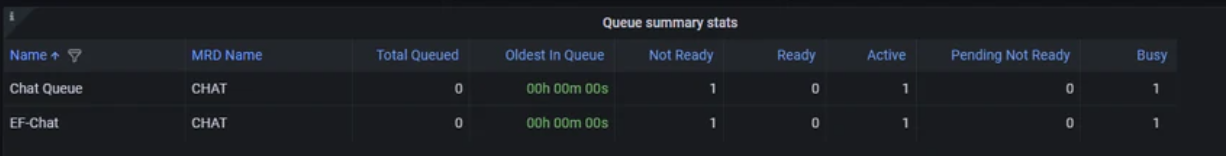
Queue Summary Statistics
This panel lists all queues in a tabular representation with summary statistics of each queue including the total queues, and the oldest in the queue. With a queue filter dropdown, select a queue name from the list to filter out the data. You can select one or multiple desired queues to be shown under this panel.
You can also apply sorting on the queue name to render the queue list in alphabetical order.
|
Queue Name |
This shows the name of the queue. Lists down all precision queues created in the system whether or not it has some conversations in the queue. |
|---|---|
|
MRD Name |
The name of the MRD that is associated with each queue by the administrator. |
|
Total Queued |
This is the total number of conversations that are currently queued to this queue |
|
Oldest in Queue |
This is the time duration of about how long a conversation stayed in a queue. This time is shown in 00:00:00 format. This is calculated out of all conversations that are currently in the queue, which is the longest waiting conversation. It stays in 00:00:00 if there's no conversation currently in the queue. |
|
Not Ready |
This is the count of agents who are currently in the Not Ready state on this queue. This is determined by the number of agents who are currently Not Ready on the MRD associated with this queue. |
|
Ready |
This is the count of agents who are currently in the Ready state on this queue. This is determined by the number of agents who are currently Ready on the MRD associated with this queue. |
|
Active |
This is the count of agents who are currently in Active state on this queue. This is determined by the number of agents who are currently Active on the MRD associated with this queue. |
|
Pending Not Ready |
This is the count of agents who are currently in the Pending Not Ready state on this queue. This is determined by the number of agents who are currently Pending Not Ready on the MRD associated with this queue. |
|
Busy |
This is the count of agents who are currently in a Busy state on this queue. This is determined by the number of agents who are currently Busy on the MRD associated with this queue. |
Service level, Average Wait Time, and Average Handle Time data are based on historical data and therefore, are updated only in the historical reporting interval (aka ETL job interval). The default interval is set to 5 minutes, however, this setting is configurable and can be changed as required by the business.
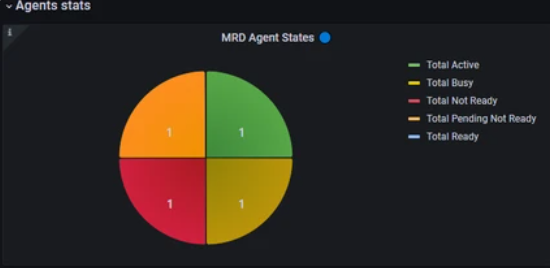
Agent States
This panel shows a pie chart where each slice of the pie shows the count of agents in each MRD state. This data is filtered using the MRDs filter dropdown on top of the dashboard.
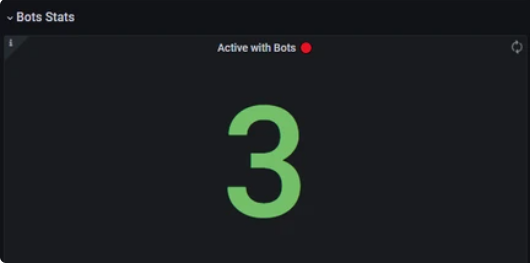
Bot Stats
This panel shows a number of active conversations that are currently active with the bot. This data is filtered using the Bots filter dropdown on top of the dashboard.
-
Currently, the software only supports having one bot. When multiple bots support will be added in the future, this filter can be used to filter conversations active with a specified bot.
-
A conversation is considered to be active with the bot unless some agent joins it.
When logging in as an agent, the Summary dashboard appears as the first screen after logging in. However, agents can only view the following panels in the Summary dashboard:
-
Queues Stats - with queues only which he is a part of
-
Queue Summary Stats - with queues only which he is a part of
Supervisors will be able to see all the rest of the panels as well.
Detailed Dashboards
The following are the dashboards where conversation details are listed. The application offers the following three types of detailed views:
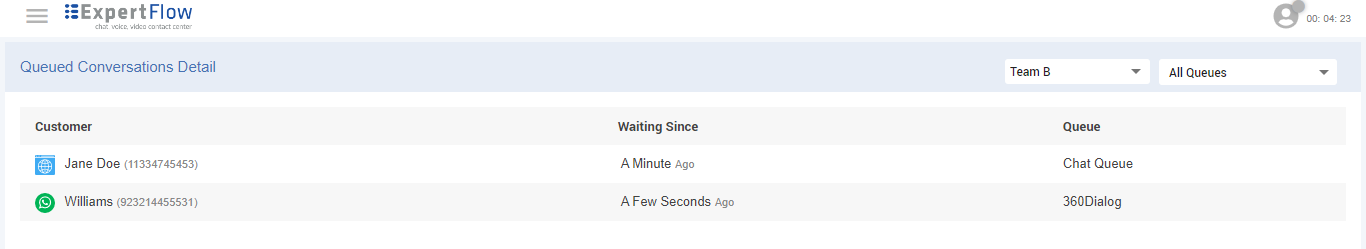
Queued Conversations Detail
This dashboard lists all conversations that are currently enqueued to a queue. With team-based implementation, supervisors can see the details of a queued conversation of one or multiple queues that are a part of a supervisor's team.
To see the desired conversation on this dashboard, use the following filters in the given sequence:
-
Team - Choose one team from the dropdown to see the relevant queues in the Queues dropdown. This allows supervisors to view conversations in the queues that they supervise.
-
Queue(s) - Based on the Team's selection, the Queues dropdown populates the queue(s) that are associated with the specified Team. Once the queue is selected, the data on the dashboard is filtered based on the selected queue. The dashboard will display data from all queues by default when a supervisor selects any team from the teams dropdown.
The following details of a conversation are available on the dashboard:
|
Field |
Description |
|---|---|
|
Customer |
Name (if identified) along with the customer channel identifier and a channel type icon to identify from which channel the customer initiated the conversation. |
|
Waiting Since |
This is the time since this conversation is enqueued. This time is shown in terms of minutes, such as <x> minutes ago. |
|
Queue Name |
The name of the queue where the conversation is enqueued |
You can change the queue from the Queues filter dropdown to see enqueued conversations on the specified queue.
The dashboard automatically gets refreshed after every 10 seconds.
-
The filter of all queues shows all queues that are part of the supervisor’s team. This does not mean that this filter shows all the queues of the contact center.
-
Agents cannot access this dashboard.
-
Adding or removing agent attributes that affect queue associations will take effect upon the agent's next login, and not in real-time on dashboards.
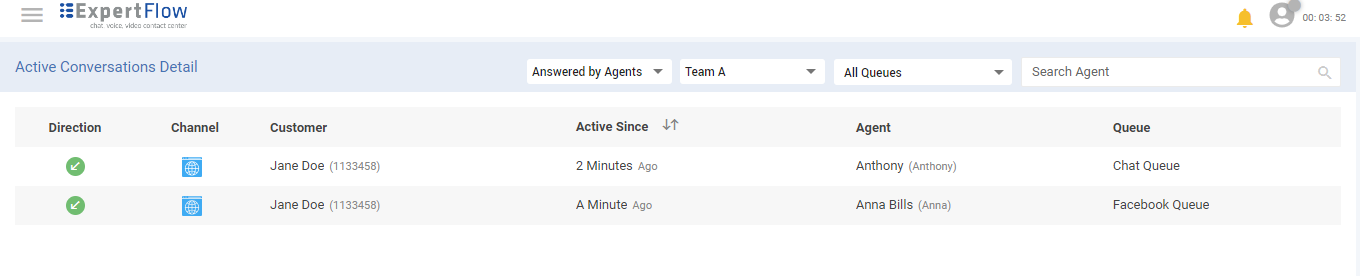
Ongoing Conversations Detail
This dashboard lists all conversations that are currently active with agents or bots. With the Team-based implementation, supervisors can now see the details of an active conversation of one or multiple queues that are a part of the supervisors' team.
To see the desired conversations on this dashboard, use the following filters in the given sequence:
-
Answered by Agents or Bots - To see active conversations with bots, switch the value in the first tab of the top row, and set the filter to Answered by Bots. By default, it is set to Answered by Agents which shows the active conversations that are currently active with agents.
-
Team - Choose one team from the dropdown to see the relevant queues in the Queues dropdown. This allows supervisors to view active conversations in the queues that they supervise.
-
Queue(s) - Based on the Team's selection, the Queues dropdown populates the queue(s) that are associated with the specified Team. Once the queue is selected, the data on the dashboard is filtered based on the selected queue. Supervisors can also choose multiple queues in the filter.
The following details of a conversation are available on this dashboard:
|
Field |
Description |
|---|---|
|
Direction |
This shows the direction of the conversation, i.e. if it is Inbound or Outbound. |
|
Channel |
This is the channel through which the customer has initiated the conversation. For instance, WhatsApp, Facebook, Webchat. |
|
Customer |
Name (if identified) along with the channel identity (for instance, WhatsApp number, Facebook name, Email) |
|
Active Since |
This is the time since this conversation became active. This time is shown in terms of minutes, such as <x> minutes ago. |
|
Agent |
This shows the Agent's name along with the user name who handled the conversation. |
|
Queue Name |
The name of the queue on which the conversation is enqueued |
For conversations that are put on hold, you can also now see them with Onhold status on the Ongoing Conversations Detail dashboard.
The dashboard gets refreshed after every 10 seconds.
-
A conversation might appear on Ongoing Conversations Detail → Answered by Bots and Queued Conversations Detail at the same time. This is when it is still with the bot and not yet routed to an available agent from the queue. However, as soon as it is routed to an agent, it disappears from the Queued Conversations Detail dashboard.
-
In case of an active conversation with any agent of the queue who is not part of the supervisor's team, the conversation will not be visible to the supervisor on the dashboard. It will only be seen by the person who is the supervisor of that agent.
-
A conversation with multiple agents from different queues will be shown as two rows on the Ongoing Conversations Detail → Answered by Agents dashboard. However, in case of an active conversation with multiple agents from the same queue, this is shown as one conversation on the dashboard.
-
If a conversation is blindly transferred to an agent (or directly transferred to a named agent), it will disappear from the Ongoing Conversations Detail dashboard.
-
Agents cannot access this dashboard.
Only inbound conversations are shown in the Ongoing Conversations Detail dashboard.
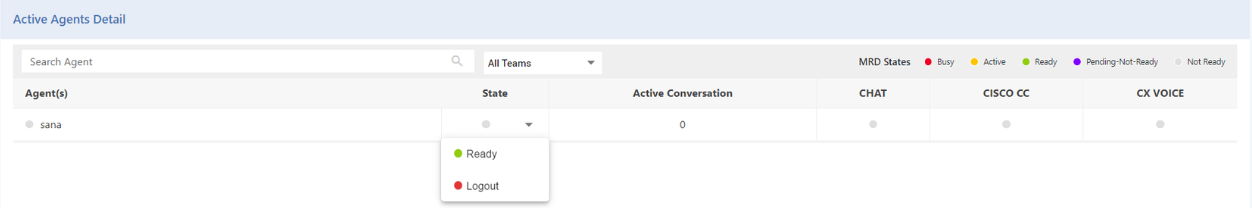
Active Agents Detail
This dashboard shows a list of all agents of a team, with a count of active conversations with each agent, and the current state of the agent in each MRD. While viewing the list of active agents with a count of active conversations, supervisors can also change an agent's state based on the agent's current state. This allows supervisors to manage long-idle agents and maintains workflow efficiency.
The supervisor can only change the global state of the agent and not its MRD state.
To do so, supervisors click on the "Change State" dropdown against the desired agent whose state needs to be changed. The only available changes for the agent's global states are:
-
From Not Ready to Ready
-
From Not Ready to Log Out
To see the desired conversations on this dashboard, use the following filters:
-
Search Agent - This filter allows the supervisor to search for a specific agent of her team.
-
Team - Choose one team from the dropdown to see the active agent's details and the current state of agents in each MRD.
The following details are available on the dashboard.
|
Field |
Description |
|---|---|
|
Agent (s) |
shows the name of an agent along with the current state Ready, Not Ready |
|
Active Conversation |
shows the number of active conversations going on with the agent for the selected queue. |
|
MRD State |
displays the current state of the agent in a particular MRD Colored circles on the upper right corner of the dashboard represent the MRD state. For more details of MRD State Transitions see < Agent State -> Change MRD States |
Limitations
-
Adding or removing agents from a team in Keycloak will take effect upon the agent's next login, not in real-time on dashboards.
-
If a supervisor is also an agent, he’ll only be able to view and see the teams in the dashboard that he supervises and not the team in which he is added as an agent.
Agents can also access this dashboard. When logged in as an agent, they can only view their own team states only.
Saving Dashboard Filters
Change the filter in any of the dashboards in Agent Desk applies to all dashboards.
While viewing the dashboards, the filters saved on one dashboard are automatically saved and valid for the other detailed dashboards as well.
For instance, if you select Team A, and Queue B on the “Queued Conversations” dashboard to view the queued conversations in Queue B, the filter will be saved and applied on the other dashboards as well. If you navigate to the “Active Conversations” dashboard, or “Active Agents Detail” dashboard, the data in the dashboards are filtered based on the filter saved on the “Queued Conversations” dashboard.
Moreover, if a filter is changed on any dashboard, the changes will be saved and applied to all the dashboards.
For Summary Dashboards, the filters saved on one Agent Desk dashboard are also applicable on the Summary Dashboard as well. Note that any filters saved on the Summary dashboard are not saved, nor communicated to the other dashboards as well.
-
The saved filters (Teams, Queues) will be stored under the browser cache.
-
If "All Teams" is selected in the "Active Agents Detail" dashboard, this filter won't be saved and won’t apply to the rest of the dashboards.
-
However, if the Teams filter is changed later in another dashboard, the same filter will also apply to the "Active Agents Detail" dashboard.
-
If dashboards or saved filters get stuck after repeated refreshes, waiting for a few seconds and then refreshing again will resolve the issue.
Summary Dashboards for Agents
The Agents dashboard shows the summary statistics of all conversations being queued, for only the queues that the agents are part of. With the Agents dashboard implementation, the agents can now navigate through queues using the Queues filter dropdown. Based on the selected queue, they can monitor the queue statistics they are part of.
Limitations
-
The saved filters (Teams, Queues) will be stored under the browser cache.
-
If "All Teams" is selected in the "Active Agents Detail" dashboard, this filter won't be applicable to the rest of the dashboards.
-
If the Teams filter is then changed in another dashboard, the same filter will also be applicable to "Active Agents Detail" dashboard.
-
If dashboards or saved filters get stuck after repeated refreshes, waiting for a few seconds and then refreshing again will resolve the issue.