This document illustrates logs aggregation using Logging Operator on source VM.
Step 1: Clone the EF-CX Repository:-
Use the following command to clone Expertflow CX repository:-
git clone -b <branch name> https://efcx:RecRpsuH34yqp56YRFUb@gitlab.expertflow.com/cim/cim-solution.git
Step 2: Change the Working Directory:-
cd cim-solution/kubernetes/logging/ELK/logging-operator/
Step 3: Deploy the Logging Operator Helm Chart:-
Deploy the helm chart using the following command:-
helm upgrade --install --namespace=logging --create-namespace --values=./values.yaml logging-operator .
Verify that the pods are running:-
k -n logging get pods
Step 4: Update the Logging Output file:-
Run the following command to apply secrets to namespaces. run this for all namespaces for which you want to aggregate logs:-
kubectl -n <namespace> create secret generic elastic-password --from-literal=password=<elasticsearch-password>
Open file for editing:-
cd ..
vi logs-aggregation/4-expertflow-ns-output.yaml
update <elastic-host> and <index-alias> in the file:-
apiVersion: logging.banzaicloud.io/v1beta1
kind: Output
metadata:
  name: expertflow-output-es
  namespace:  expertflow
  labels:
          ef: expertflow
spec:
      elasticsearch:
        host: <elastic host>
        port: 30920
        user: elastic
        index_name: <index-alias>
        password:
          valueFrom:
            secretKeyRef:
              name: elastic-password   #kubectl -n logging create  secret generic  elastic-password  --from-literal=password=admin123
              key: password
        scheme: https
        ssl_verify: false
        #logstash_format: true # this creates its own index, so dont enable it
        include_timestamp: true
        reconnect_on_error: true
        reload_on_failure: true
        buffer:
          flush_at_shutdown: true
          type: file
          chunk_limit_size: 4M # Determines HTTP payload size
          total_limit_size: 1024MB # Max total buffer size
          flush_mode: interval
          flush_interval: 10s
          flush_thread_count: 2 # Parallel send of logs
          overflow_action: block
          retry_forever: true # Never discard buffer chunks
          retry_type: exponential_backoff
          retry_max_interval: 60s
        # enables logging of bad request reasons within the fluentd log file (in the pod /fluentd/log/out)
        log_es_400_reason: true
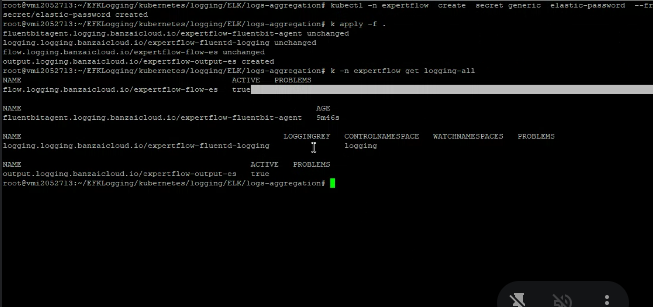
Run the following command to make sure logging is active:-
k -n logging get pods
output should be as following:-

Step 5: Deploy the FluentBit:-
Deploy the FluentBit using the following command:-
kubectl apply -f logs-aggregation/
Step: 6: Monitor logs:-
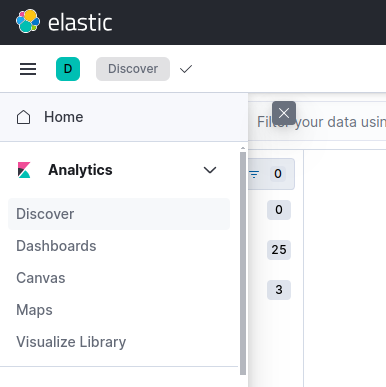
Login into Kibana with the relevant credentials and head over to Discover under Analytics to monitor logs:-
