For Helm-based deployment of MSSQL follow step 1. For standalone deployment of MSSQL, follow step 2.
Step 1: Update MSSQL Helm Chart
open the values.yaml file for MSSQL and update the following data:-
metrics:
  enabled: true
  image:
    registry: docker.io
    repository: awaragi/prometheus-mssql-exporter
    tag: v1.3.0
    digest: ""
    pullPolicy: IfNotPresent
    pullSecrets: []
  service:
    type: ClusterIP
    port: 4000
    annotations:
      prometheus.io/scrape: "true"
      prometheus.io/port: "{{ .Values.metrics.service.port }}"
  extraArgs:
    primary:
       - --collect.auto_increment.columns
       - --collect.binlog_size
       - --collect.engine_innodb_status
       - --collect.engine_tokudb_status
       - --collect.global_status
       - --collect.global_variables
       - --collect.info_schema.clientstats
       - --collect.info_schema.innodb_metrics
       - --collect.info_schema.innodb_tablespaces
       - --collect.info_schema.innodb_cmp
       - --collect.info_schema.innodb_cmpmem
       - --collect.info_schema.processlist
       - --collect.info_schema.processlist.min_time
       - --collect.info_schema.query_response_time
       - --collect.info_schema.tables
       - --collect.info_schema.tables.databases
       - --collect.info_schema.tablestats
       - --collect.info_schema.userstats
       - --collect.perf_schema.eventsstatements
       - --collect.perf_schema.eventsstatements.digest_text_limit
       - --collect.perf_schema.eventsstatements.limit
       - --collect.perf_schema.eventsstatements.timelimit
       - --collect.perf_schema.eventswaits
       - --collect.perf_schema.file_events
       - --collect.perf_schema.file_instances
       - --collect.perf_schema.indexiowaits
       - --collect.perf_schema.tableiowaits
       - --collect.perf_schema.tablelocks
       - --collect.perf_schema.replication_group_member_stats
       - --collect.slave_status
       - --collect.slave_hosts
       - --collect.heartbeat
       - --collect.heartbeat.database
       - --collect.heartbeat.table
once the values mentioned above are updated, upgrade the MSSQL helm deployment.
Step 2: Deploy MSSQL Exporter
Create a file mssql-exporter.yaml for mssql-exporter Deployment and Service and paste the content below. Also, update the values for environment variables.
apiVersion: apps/v1
kind: Deployment
metadata:
  name: sql-exporter
  namespace: ef-external
  labels:
    app: sql-exporter
spec:
  replicas: 1
  selector:
    matchLabels:
      app: sql-exporter
  template:
    metadata:
      labels:
        app: sql-exporter
    spec:
      containers:
      - name: sql-exporter
        image: awaragi/prometheus-mssql-exporter:latest
        env:
        - name: SERVER
          value: "your-mssql-server"
        - name: USERNAME
          value: "your-username"
        - name: PASSWORD
          value: "your-password"
        - name: DEBUG
          value: "app"
        - name: PORT
          value: "1433"
        ports:
        - containerPort: 4000
---
apiVersion: v1
kind: Service
metadata:
  name: mssql-metrics
  namespace: ef-external
spec:
  selector:
    app: sql-exporter
  ports:
    - port: 4000
      targetPort: 4000
Deploy the resources:-
kubectl apply -f mssql-exporter.yaml
Step 3: Update the Monitoring Solution Helm Chart
Update the following values in the Kube-Prometheus-Stack (Monitoring solution) helm chart.
additionalScrapeConfigs:
      - job_name: mssql
        scrape_interval: 30s
        static_configs:
         - targets: ['mssql-metrics.ef-external.svc.cluster.local:4000']
once the values mentioned above are updated, upgrade the monitoring solution.
Step 4: Add the MSSQL Dashboard
-
Open the monitoring solution via
{FQDN}/monitoringin your browser and log in. -
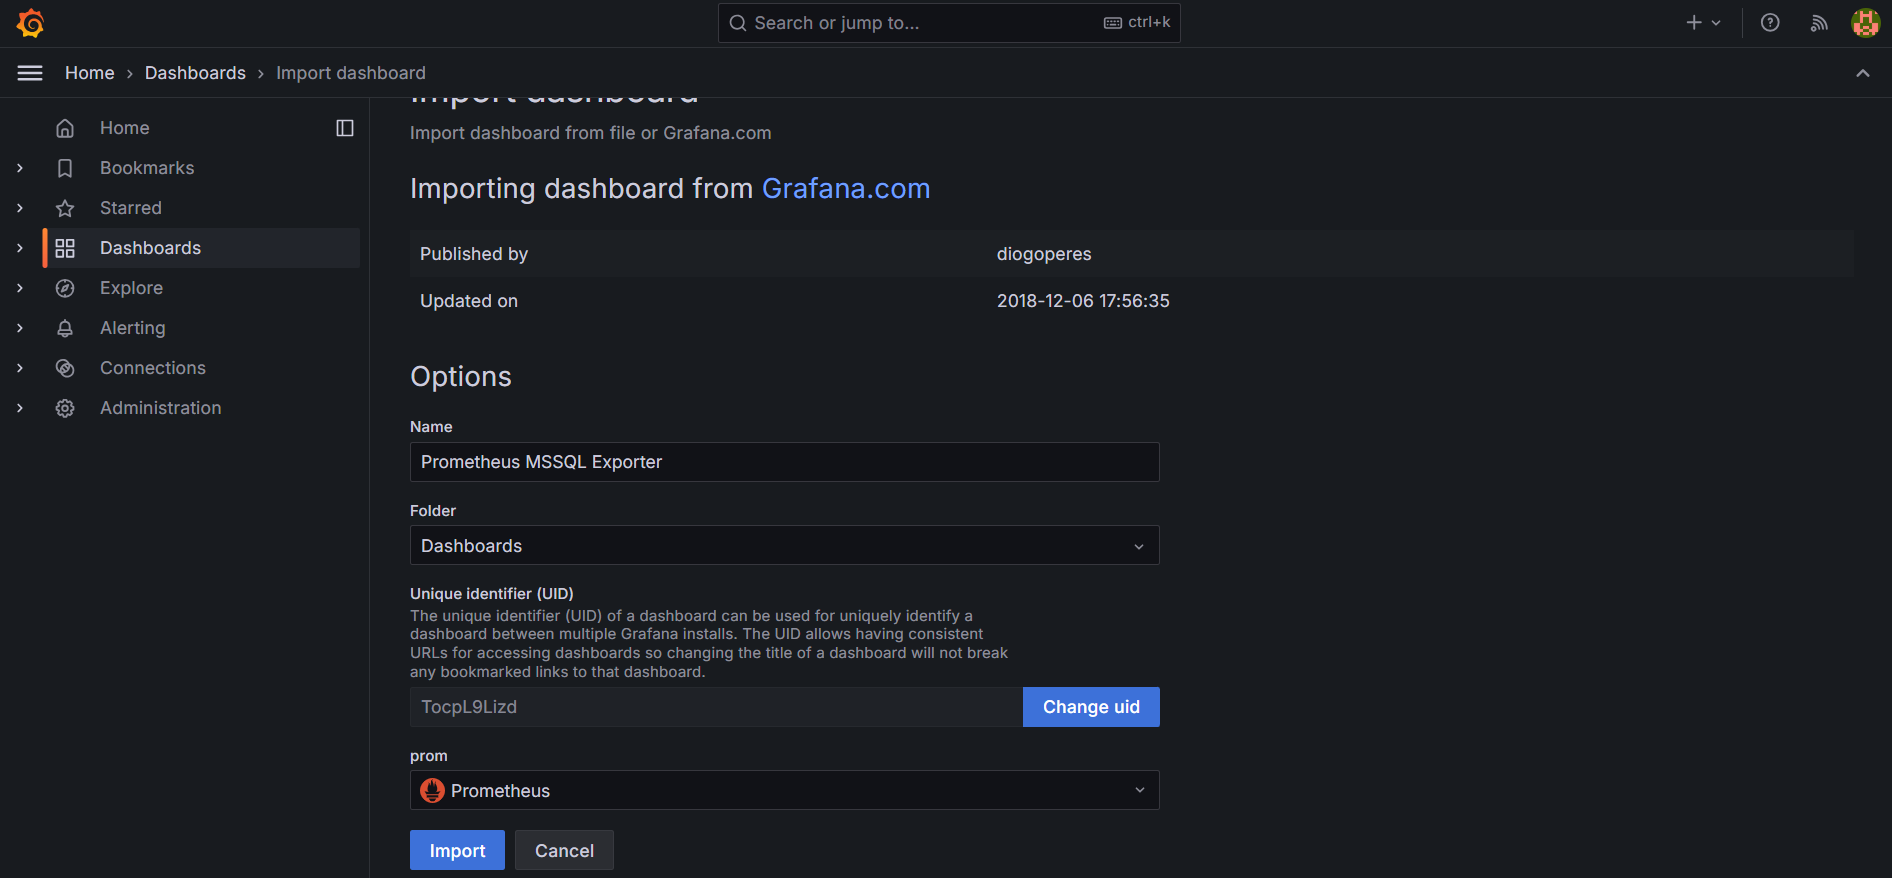
Head over to Dashboards and import dashboard with dashboard ID
9336. -
Select
Prometheusas the datasource and import the dashboard.
-
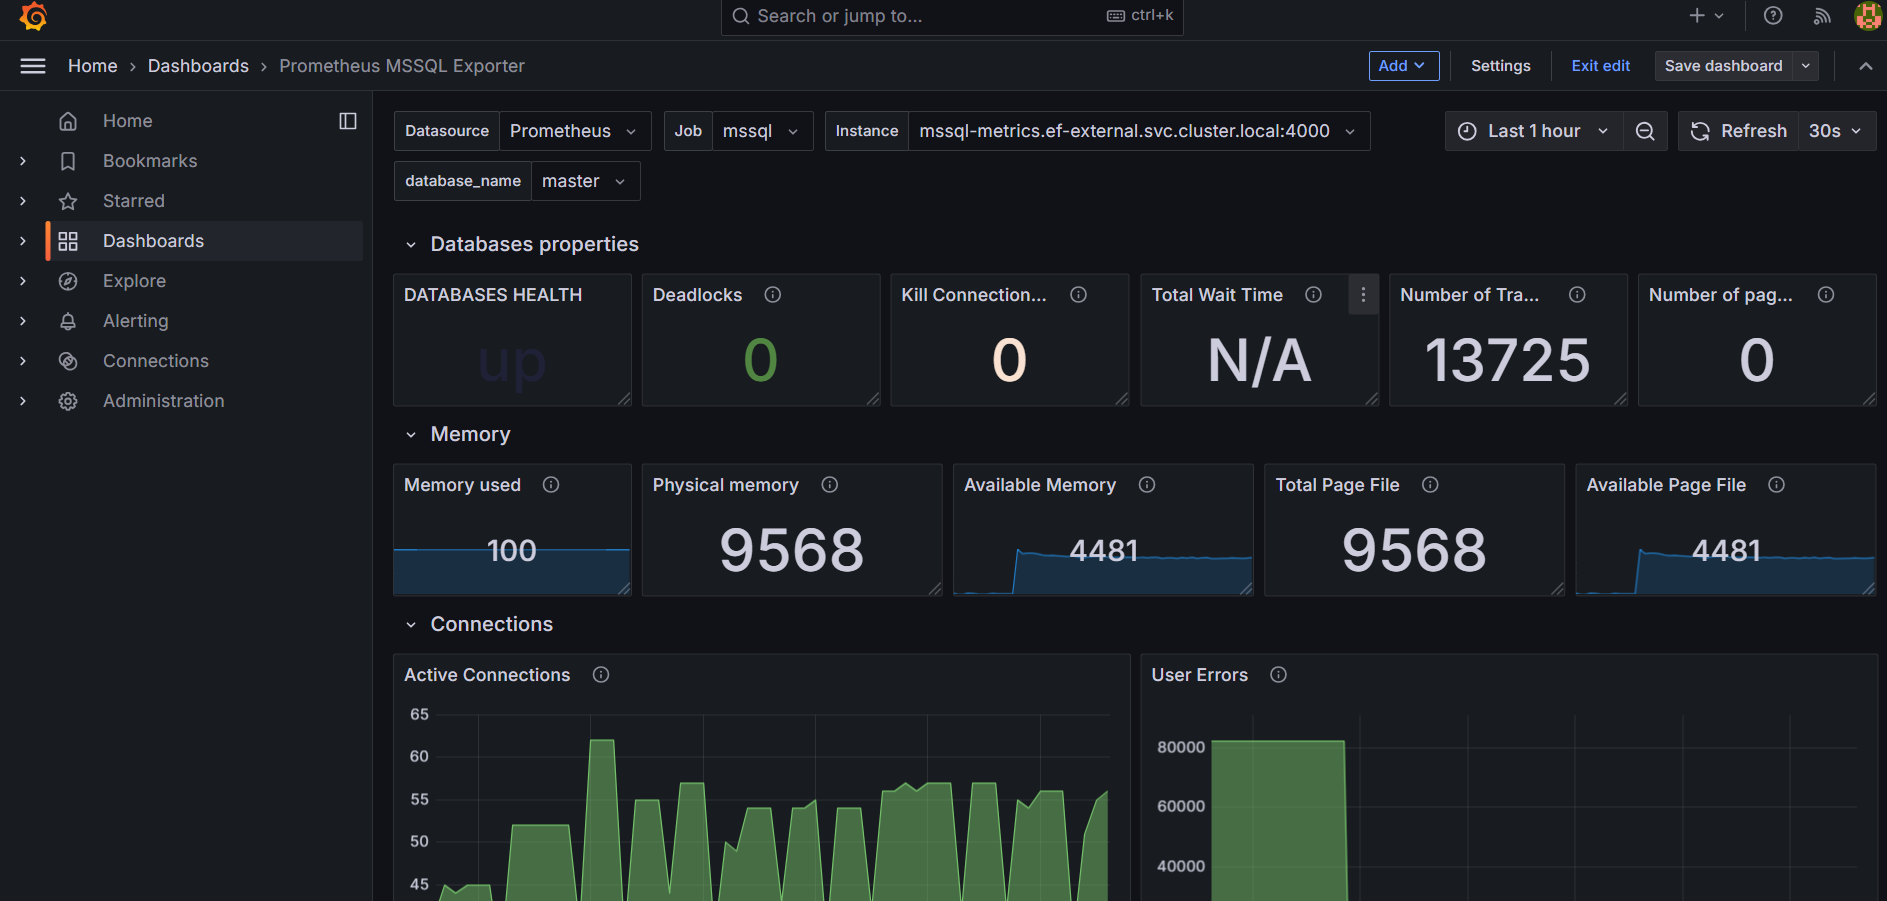
Once the dashboard is imported, select
mssqlin Job field to visualize metrics in the dashboard as shown below:-