Introduction
ExpertFlow Dashboards & Wallboards application allows the contact center administrators, supervisors and agents to customize new dashboards as per the needs of the business. Each user can create its own dashboard or admins create a contact center Wallboard to be displayed on a large screen in a room. It is currently only availble for Cisco CC's, not for EF CC.
The application comes with predefined gadgets (display types ) to be added on a dashboard container. The user can then customize the gadget to see the attributes important to the business while hiding the rest of the other attributes.
There are six different templates. So user can create dashboard in six different ways. User can also add gadgets to the dashboard. The gadgets are
|
|
Different dashboards can be added in a Dashboard Group. The link can be generated for the dashboard and dashboard group. The dashboard can also be copied. User can also add Data Services URL in it. Settings are used to update the logo
Business Features
Gadget-Oriented Dashboards
ExpertFlow Dashboards & Wallboards application allows the contact center administrators, supervisors and agents to customize new dashboards as per the needs of the business. Each user can create its own dashboard or admins create a contact center Wallboard to be displayed on a large screen in a room.
The application comes with predefined gadgets (display types and data stats) to be added on a dashboard container. The user can then customize the gadget to see the attributes important to the business while hiding the rest of the other attributes.
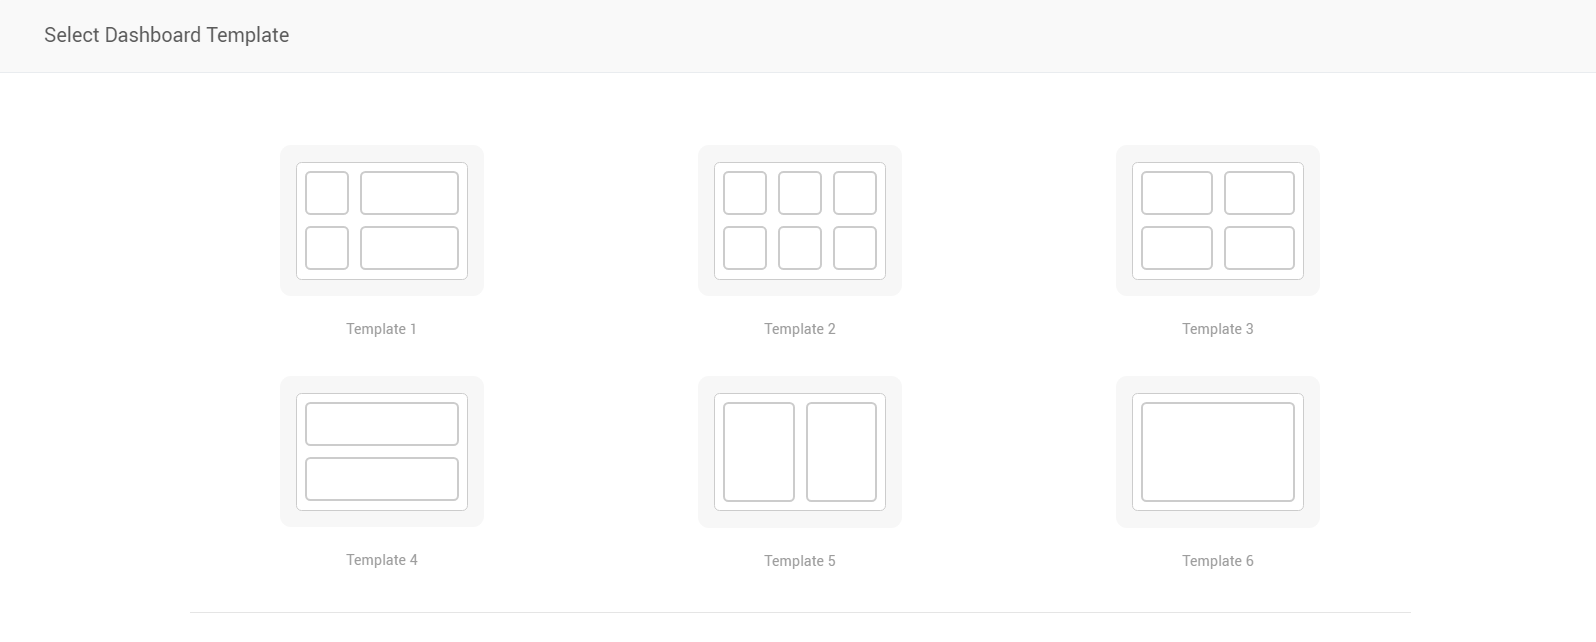
Predefined Layouts/ Dashboard Templates
The application also provides some predefined templates to be used while designing the dashboards. Each time the user has to create a dashboard, it chooses a template from the list of predefined templates to define the dashboard layout. Gadgets are then added to the dashboard following the selected template.
Display Types
The display type defines how the data will be displayed in a gadget. A user-defined gadget is a component which has a specific display type and the data logic as defined by the user while creating the dashboard.
Following are the visuals and display types as available today:
-
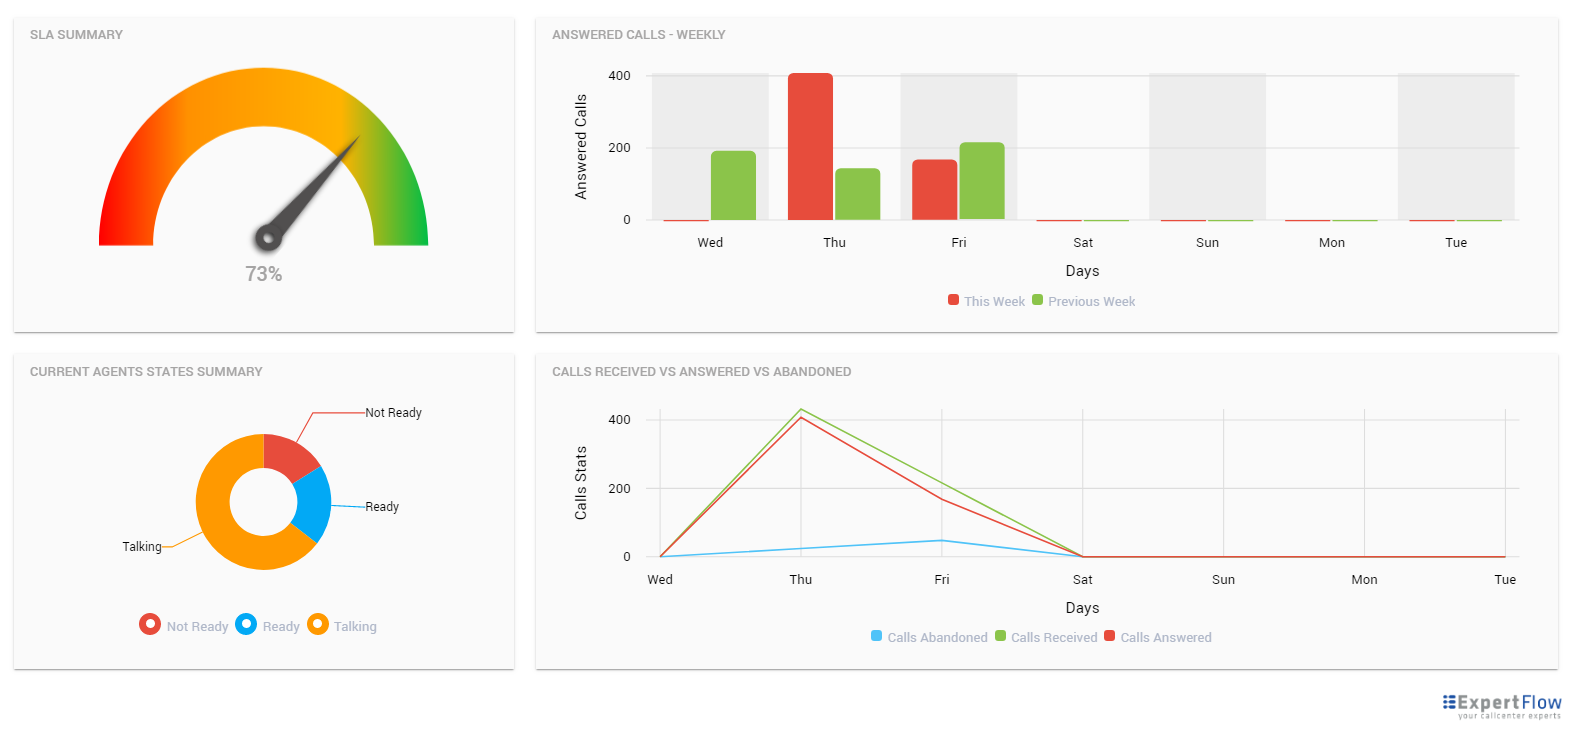
Pie Chart: Draws the data in the form of a pie. Used to display real-time data across particular answer categories. While showing call center stats, this display type is particularly useful for showing current states of agents in teams with Agent Data Service.
-
Doughnut Chart: Draws the data in the form of a doughnut. Used to display real-time data across particular answer categories. While showing call center stats, this display type is particularly useful for showing current states of agents in teams with Agent Data Service.
-
Scorecards: Each data attribute is represented by a square box called a "scorecard". While viewing call center stats, this display type is particularly useful for viewing real-time queue stats and reporting interval stats (for CCE only) of Queue Data Service.
-
Line Chart: Draws a line chart of the selected data statistics based on the specified resolution (daily, hourly). While viewing call center stats, this display type is only relevant for showing historical data of Queue Data Service for calls answered, abandoned, and received.
-
Bar Chart: Draws a bar chart of the selected data statistics based on the specified resolution. While viewing call center stats, this display type is only relevant for showing historical data of Queue Data Service for calls answered, abandoned, and received.
-
Text Message: To display a static text message on the dashboard.
-
Greeting Message: To display a static text message with a greeting such as "Good Morning Team!" on the Wallboard
-
Data Table: To display data in a tabular format. This display type is used to show the real-time and reporting interval stats (for CCE). While viewing call center statistics, see the agent teams summary across all teams in a table, using Agent Data Service.
See the screenshot below.
Data Services
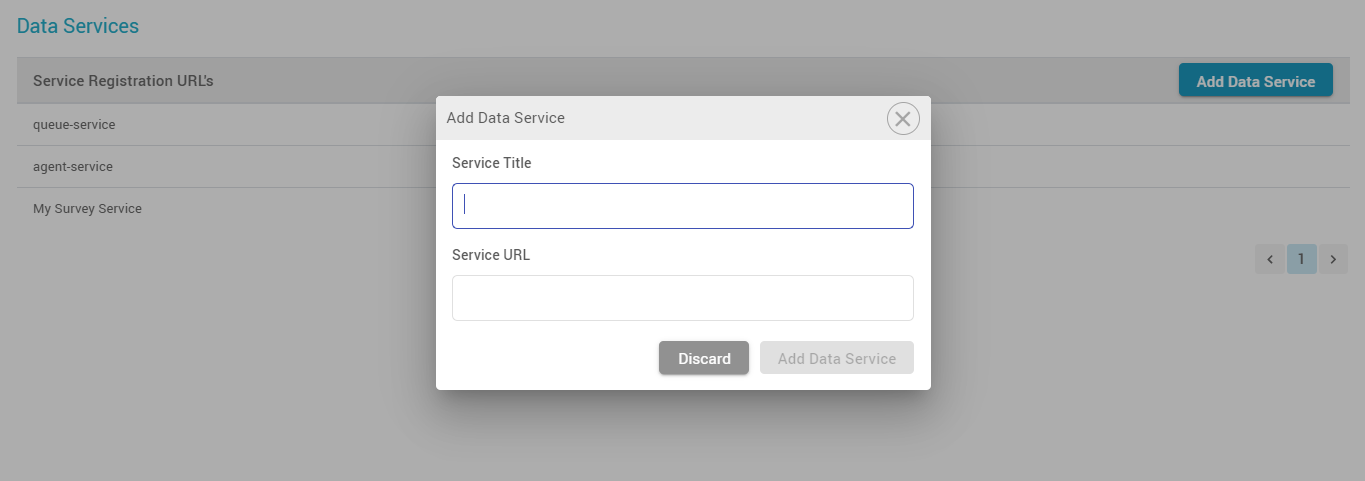
Dashboards or Wallboards refer to a data service (or data source) to report on the statistical data in a gadget. A Data Service is a REST+GraphQL-based microservice that returns real-time and historical data attributes to be displayed on Dashboards and Wallboards.
The application comes with two prebuilt data services that report on queues and agent statistics.
-
Queue Service: This reports all the statistics related to the contact center queues/ skill groups such as calls received, answered, abandoned, SLA.
-
Agent Service: This reports all the statistics related to the team agents such as Current state, Time in the state, ASA, AHT of agents.
Any 3rd-party application can also write its own data services to return any real-time and historical data to be displayed on dashboards and wallboards. For instance, a data service connected to the reporting DB of a CRM to report on statistics from the CRM.
Consolidate Call Center Stats
See the consolidated statistics of the call center by selecting all (or not selecting any) skill groups while drawing a gadget on the dashboard. Choose the data aggregation type as one of the following:
-
Sum: Choosing this option sums up data of all selected attributes across all skill groups or teams.
-
Average: Choosing this option takes an average of all selected attributes across all skill groups or teams. This is also the default aggregation type for the Speedometer display type.
-
Count: This counts the occurrences for a particular value in the database and shows the total count. This is the default aggregation type for Pie and Doughnut charts and is currently only applicable to Pie and Doughnut display types.
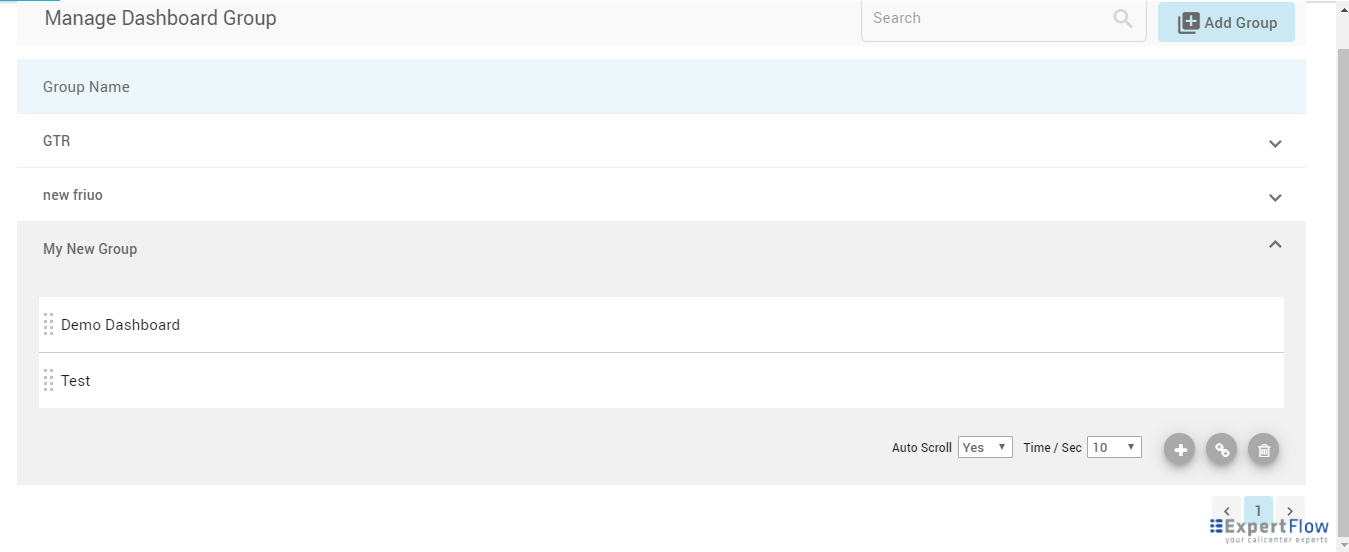
Dashboard Groups
A dashboard group is a group of multiple dashboards that allows the user to set scrolling intervals to display each dashboard in the group one by one.
Generate a URL of the group to see all dashboards in the group in the browser window.
No user authentication is required for now to access the final link of a dashboard group.
Auto scrolling and ordering among dashboards in a group
The auto-scrolling feature allows scrolling dashboards in a group in the sequence and interval as configured in the Dashboard Group definition.
Link sharing of dashboards and dashboard groups
Get the URLs to the dashboards and dashboard groups to see your final dashboard(s) as Wallboards on a big screen in a browser tab.
By default, anyone with the link can access the dashboards. No user authentication is required for now to access the final dashboards.
Light and Dark Color Backgrounds
Choose a dark color theme to display your wallboard with a darker background or a light theme to display it on a lighter background.
APIs for 3rd-parties to report external system statistics
ExpertFlow exposes Data Services model to urge external systems to report on their data in the ExpertFlow Dashboard application.
Each system that has to show some reporting data in the ExpertFlow Dashboards application needs to write a data service (REST / GraphQL APIs) to expose the data attributes in the format that ExpertFlow shares. The application then calls the APIs of the external Data Service to display the statistics from the 3rd-party data service in the dashboard.
Note:
-
Multi-tenancy on Dashboards is not supported as of today; i.e. a user, for instance, who has the access to the application can view all dashboards irrespective of the tenant or team to which he belongs.
Solution Components and Architecture
Communication Flow Diagram
The following diagram depicts the different components of the Dashboard application and the flow between each.
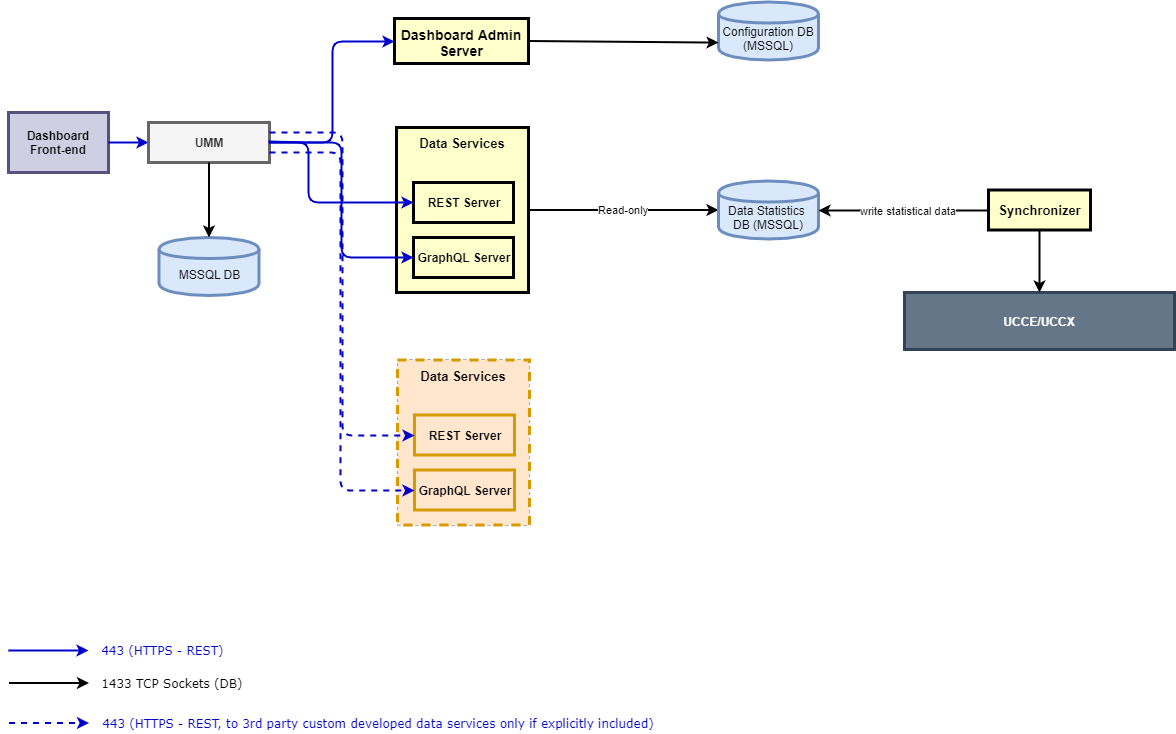
Below is the detail of each individual component.
Dashboard Frontend
This is the admin front-end that is responsible to serve the application front-end interface.
Dashboard Admin Server
This is the component that serves the Admin UI of the Dashboard application. This controls all the admin-related functions of the application.
Data Services
A Data Service in the Wallboard application is a REST+GraphQL-based microservice that returns real-time and/or historical data attributes to be displayed on Dashboards and Wallboards.
The application comes with two prebuilt data services that report on call center queues and agent statistics.
-
Queue Service: This reports all the statistics related to the contact center queues/ skill groups such as calls received, answered, abandoned, SLA.
-
Agent Service: This reports all the statistics related to the team agents such as Current state, Time in the state, ASA, AHT of agents.
Any 3rd-party application can also write its own data services to return any real-time and historical data to be displayed on dashboards and wallboards. For instance, a data service connected to the reporting DB of a CRM to reporting on statistics from the CRM.
Synchronizer
This component syncs contact center stats from the CC Database and dumps into the local database. The synchronizer refreshes/updates the real-time stats in the database every 5 seconds while, for the historical data, the stats are refreshed after every 5 minutes. However, for CCE deployments, this depends mainly on the real-time and historical data refresh interval set on the CCE side; i.e. for example, if the reporting interval for refreshing historical interval stats is set to 30 minutes, the new historical data are only available to be viewed on the dashboard after 30 minutes. Please note that the reporting interval stats are also always refreshed and updated when the new data is available for the next reporting interval.
Synchronizer/Data Services DB
The database where the synchronizer component pushes the detailed statistics of the contact center. The default data services of the Dashboard application read the data from the same DB to show those stats on the front-end.
External systems can also expose similar data services and develop a respective synchronizer component to store the statistics in its own DB.
Dashboard Admin Server DB
This is the configuration database that carries all configuration/administrative changes. This includes management of dashboards, dashboard groups and other actions being done from the admin portal.
User Management
The User Management (UMM) microservice allows administrators to create local users or get all contact center users and give them restricted access to the application. For instance, an agent can only view dashboards but a supervisor can create and manage dashboards and dashboard groups.
Each user that is logged into the Dashboard application gets authenticated by the UMM, which further checks its access permissions to segregate what the user can see after getting logged in. Please note that each user upon a valid logon has access to view all dashboards in the admin application. However, any user can only make changes to dashboards if given the respective permission to do that.
User-based access to selective dashboards is currently not available. That is, dashboards cannot be created or assigned to selective teams.
User Management DB
The Database of UMM keeps the information about all users and the privileges assigned to them. All contact center users are synchronized by default with UMM whereas an admin can also create local user accounts. Customized roles can be created to assign selected permissions to certain users (both DB and Contact Center users). Each synced user from Cisco Finesse / CUCM has the default role "Agent" assigned to it. You can always change roles and assign selective permissions to the roles.
Integration with Cisco Unified CCE
The application comes with two default data services to report on queues and agent statistics.
-
Queue Service: This reports all the statistics based on the skill groups such as calls received, answered, abandoned, SLA.
-
Agent Service: This reports all the statistics based on the team such as agents, their current state, Time in the state, ASA, AHT of agents.
The following sections elaborate more on the list of attributes exposed by the two data services.
Queue Data Service
Attribute Filter
The data service allows creating dashboards based on call center skill groups for reporting statistics such as (number of calls answered, received, SLA, etc.). Hence, the following attribute filters are exposed to Queue service in case of CCE deployment:
-
Skill Group: This lists all skill groups available in the CCE database. To show skill group stats, we refer to the following tables of CCE for realtime and historical data respectively; i) Skill_Group_Real_Time ii) Skill_Group_Interval.
It is mandatory to select the attribute filter to show some data on the wallboard. So the statistical data is then compiled/ accumulated based on one or multiple selected skill groups (or all skill groups for no selection).
Data Service Attributes
You can design the dashboard with the following exposed attributes of the data service:
|
Attribute Name |
Description |
|---|---|
|
SLA (5m) |
This field shows the SLA on the skill group(s) in the rolling five-minute interval. After five minutes, this data either flushes out or updated depending upon the incoming calls in the next 5 minutes. This the ServiceLevelTo5 field in the Skill_Group_Real_Time table in the case of Attribute filter "Skill Group". |
|
SLA (Reporting Interval) |
This field shows the value of the SLA in the last reporting interval (unlike the one above for rolling five minutes only). This is retrieved from the Skill_Group_Interval table and corresponds to the ServiceLevel field in the table. The value of this field is automatically updated or refreshed when the new data for the next reporting interval becomes available. |
|
Calls Received (5m) |
This field shows the received calls on the skill group(s) in the rolling five-minute interval. After five minutes, this data either flushes out or updated depending upon the incoming calls in the next 5 minutes. This maps to the RouterCallsOfferedTo5 field in the Skill_Group_Real_Time table in the case of Attribute filter "Skill Group". |
|
Calls Received (Reporting Interval) |
Choose this field to show the total received calls in the last reporting interval on this skill group. This is retrieved from the Skill_Group_Interval table and corresponds to the RouterCallsOffered field in the table. The value of this field is automatically updated or refreshed when the new data for the next reporting interval becomes available. |
|
Calls Answered (5m) |
This field shows the answered calls on the skill group(s) in the rolling five-minute interval. After five minutes, this data either flushes out or updated depending upon the incoming calls in the next 5 minutes. This maps to the CallsAnsweredTo5 in the Skill_Group_Real_Time table in the case of Attribute filter "Skill Group". |
|
Calls Answered (Reporting Interval) |
Choose this field to show the total answered calls in the last reporting interval on this skill group. This is retrieved from the Skill_Group_Interval table and corresponds to the CallsAnswered field in the table. The value of this field is automatically updated or refreshed when the new data for the next reporting interval becomes available. |
|
Calls Abandoned (5m) |
This field shows the abandoned calls on this skill group in the rolling five-minute interval. After five minutes, this data either flushes out or updated depending upon the incoming calls in the next 5 minutes. This maps to the RouterCallsAbandQTo5 in the Skill_Group_Real_Time table in the case of Attribute filter "Skill Group". Only calls that abandon on the skill group (queued to skill group) will be reported with this attribute. |
|
Calls Abandoned (Reporting Interval) |
Choose this field to show the total abandoned calls in the last reporting interval. This is retrieved from the Skill_Group_Interval table and corresponds to the RouterCallsAbandQ field in the table. The value of this field is automatically updated or refreshed when the new data for the next reporting interval becomes available. |
|
Calls in Queue |
This field shows the number of calls in queue for the given skill group(s). This corresponds to the RouterCallsQNow field in the Skill_Group_Real_Time table in the case of Attribute filter "Skill Group". |
|
Longest Call In Queue |
This field shows the longest time a call remained in the queue on the given skill group(s). This corresponds to the RouterLongestCallInQ field in the Skill_Group_Real_Time table in the case of Attribute filter "Skill Group". In the case of selecting multiple skill groups, this field shows the call which remained in the queue for a maximum time across all skill groups. |
|
Average Wait Time (5m) |
This field shows the average wait time on the skill group(s) in the rolling five-minute interval. After five minutes, this data either flushes out or updated depending upon the incoming calls in the next 5 minutes. This is calculated as: (AnswerWaitTimeTo5/CallsAnsweredTo5) from the Skill_Group_Real_Time table in the case of Attribute filter "Skill Group". |
|
Average Talk Time (5m) |
This field shows the average talk time on the skill group(s) in the rolling five-minute interval. After five minutes, this data either flushes out or updated depending upon the incoming calls in the next 5 minutes. This corresponds to the AvgHandledCallsTalkTimeTo5 field in the Skill_Group_Real_Time table. |
|
Average Talk Time (Reporting Interval) |
Choose this field to show the average talk time in the last reporting interval. This is retrieved from the Skill_Group_Interval table and corresponds to the AvgHandledCallsTalkTime field in the table. The value of this field is automatically updated or refreshed when the new data for the next reporting interval becomes available. |
|
Agents Ready |
This field shows the number of ready agents on the skill group(s). This is the Ready agents from the Skill_Group_Real_Time table. This also displays all agents who are in any state other than Not_Ready and Work_Not_Ready. |
|
Agents Not Ready |
This field shows the number of not ready agents on the given skill group(s). This is the Not Ready field in the Skill_Group_Real_Time table. |
|
Agents Logged In |
This field shows the number of logged-in agents on the given skill group(s). This is the LoggedOn field in the Skill_Group_Real_Time table. |
|
Agents Talking |
This field shows the number of talking agents on the given skill group(s). This is the TalkingIn field in the Skill_Group_Real_Time table. |
-
To view the real-time stats of call center agents (Ready, Not Ready, Talking), it is suggested to use the Agent Data Service with Pie/Doughnut (summary of ready, not ready states) and Data table (for individual agent stats) display types while viewing the stats team-wise. This is because since an agent can be a part of multiple skills, viewing agent states summary skill-group wise might not depict the true picture of the call center.
-
The statistical data for the Reporting Interval attributes either flush or is overwritten automatically when the reporting interval expires and the new interval starts. So if the stats in the new interval are 0, the data stats become 0. If the stats are updated, the updated stats in the new reporting interval would be displayed.
-
Since the stats are reported based on call center skill groups, only calls that actually land on the skill groups are available for reporting.
-
There’s a difference between “Reporting Interval” stats and “Historical” stats. The “Historical” stats are calculated based on the interval stats but are persistent in the DB. Such Historical stats are only available for Calls Answered/Abandoned/Received attributes of the Queue Data Service and can only be seen in the Line/Bar charts display types.
-
The “Reporting Interval” stats only last for the reporting interval configured on CCE and are refreshed when the new data for the next interval becomes available. Those interval stats can be seen in Scorecards, Speedometer display types.
Agent Data Service
Attribute Filter
The application shows the following attribute filters for Agent service in case of CCE deployment:
-
Team: This lists all CCE teams in the CCE database.
Data Service Attributes
You can design the dashboard with the following exposed attributes of the data service:
|
Attribute Name |
Description |
|---|---|
|
First Name |
This is the first name of the agent |
|
Last Name |
This is the last name of the agent |
|
Current State |
This is the current Finesse state of the agent. This refers to the AgentState field in the Agent_Real_Time table. This field caters the following states only:
|
|
State Duration: |
This is the time since the agent is in the current state. This refers to the DateTimeLastStateChange field in the Agent_Real_Time table |
|
ASA |
This field shows the average speed of answer to answer inbound voice calls per agent. This is calculated as (SUM(AnswerWaitTime)/SUM(CallsAnswered)) per agent against all skill groups from the Agent_Skill_Group_Interval table |
|
AHT |
This field shows the average handling time for handling inbound voice calls per agent. This is calculated as (SUM(HandledCallsTime)/(SUM(CallsHandled)) from the Agent_Skill_Group_Interval table |
-
Any type of historical statistics is not available for Agent Data Service. This means that only real-time data is available for team agents.
-
On the Queue Service, only the historical data of "Calls Received/ Answered /Abandoned" is available. These historical data attributes are different from the same attributes for the Reporting Interval who automatically get reset or updated when the new interval starts.
Deployment Models
Deployment Architecture
For HA, ExpertFlow deploys the solution on two VMs as Docker containers using Docker Compose. If one VM goes down, the traffic will be routed to the other VM.
Each solution component is deployed as a stateless microservice in its own Docker container. Expertflow opted for a service-per-container paradigm in which each backend microservice is executed in its separate container.
Each Docker container is deployed with the “Restart Always” policy which causes it to restart automatically on the same VM. Notice that there might be a downtime of a few seconds while restarting the container. This implies that any requests received during the downtime will be rejected.
Services will be available via a virtual IP. If one of the VMs goes down, the virtual IP will route the traffic to the other VM.

Failover scenarios
The following table lists the various failover scenarios and the behavior of the different solution components in each scenario:
|
Failover Scenarios |
Behavior |
|---|---|
|
Synchronizer failover |
Synchronizer component runs in an active-active state on both the VMs, using a heartbeat mechanism. The active synchronizer updates its state in the DB after every 2 minutes.
|
|
Synchronizer restores after failover |
If and when the previous, non-active synchronizer comes up again after the failover is successfully completed, the stats appearing on the gadgets become zero for a second once again. It continues to work afterward. |
|
VM failover |
The application runs on both VMs. When one VM goes down or failover happens, the user can still continue to perform all the CRUD operations on the application front-end. However, since the insertion of the active synchronizer state is updated in the DB after every 2 minutes, the synchronizer stops syncing the stats with Cisco DB for 2 minutes. Once the newly-active synchronizer instance takes full control, all stats become zero for a second and then get refreshed afterward. |
Solution Security
Permissions-based User Access
The User Management (UMM) microservice allows administrators to create local users or get all contact center users and give them restricted access to the application. For instance, an agent can only view dashboards but a supervisor can create and manage dashboards and dashboard groups.
Each user that is logged into the Dashboard application gets authenticated by the UMM, which further checks its access permissions to segregate what the user can see after getting logged in. Please note that each user upon a valid login has access to view all dashboards in the admin application. However, any user can only make changes to dashboards if given the respective permission to do that.
Note:
-
Currently, the permissions can only be granted on selective lists/entities. More granular permissions on the level of selective fields or certain data cannot be granted.
-
The password reset option is not available for local users. If a local user has forgotten his password, he needs to request the admin to create a new account to get logged in.
-
User-based access to selective dashboards is currently not available. That is, dashboards cannot be created or assigned to selective teams.
The application also allows administrators to create local user accounts for supervisors or/and agents with a user-defined password and username. Restricted permissions on the level of entities allow administrators to assign selective privileges to a particular group of users. For instance, allow call center agents to view all dashboards while restricting any edits, while allowing supervisors to create and manage dashboards on their own.
HTTP/S Support
The application supports HTTP and HTTPS. However, to run the application over HTTPS requires to get a domain-signed certificate from a valid CA.
Cisco Contact Center Fail over
The application currently only supports handling the failover of Cisco Unified CCX within the application.
When the CCX Master node fails over to the subscriber node, the subscriber node becomes the new Master. Due to this change, calls start landing on the new Master node, hence, all the real-time stats in CCX are refreshed and the count starts from zero as if the deployment is refreshed. This also affects the real-time stats shown on the EF application.
All the real-time data displayed in the following display types may affect with the CCX failover:
-
Speedometer
-
PIE Chart
-
Doughnut Chart
-
Scorecards (all variations)
-
Data Table
However, all the historical stats in the Wallboard application remain unchanged. This means that the historical views, the Bar Chart and Line Chart, will not be affected by the CCX failover and will continue to show/update the historical data.
CCE Failover handling is not supported for now.
System Limitations
|
Summary |
Description |
|
SLA is calculated based on a hardcoded formula for CCX |
For CCX, the SLA is calculated as the following: SLA = (Calls Handled/Total Calls) x100
For CCE, the SLA of a skill group is retrieved from the Skill Group tables in the CCE Database. See Integration with Cisco Unified CCE for more details. |
|
SSO enabled UCCX/UCCE |
User tries to login SSO enabled agent with SSO disabled settings from the environment variables than for UCCX agent will not login into the wallboard and for UCCE agent is able to login into the wallboard application |
|
Timezone implementation is for the historical data |
Timezone implementation applies to historical data only. The gadgets used for historical data are Line and Bar charts. |
|
Date and Time on the dashboard/wallboard on the final link |
Date and Time of the Dashboards&Wallboards are based on the machine/browser settings where it is opened. |
|
In CCE, an agent in the "Talking" state is also reflected in the "Ready" state |
In CCE, an agent in the "Talking" state is also reflected in the "Ready" state. |
|
For CCE, a call that gets abandoned after getting routed to an agent by skill group is not available for reporting |
A call that gets abandoned by the customer after being routed to an agent is not available for reporting purposes and thus, is not shown in the EF dashboards. However, this may affect the SLA of the skill group. |
|
For CCE, the application currently only displays stats based on skill groups and not on precision queues |
For CCE, the application currently only displays stats based on skill groups and not on precision queues |
|
Only the call center calls are available for reporting on EF dashboards & wallboards |
Only the inbound voice calls routed by the call center are reported on the dashboards. This means that any internal, ACD, outbound calls or other non-inbound customer calls are NOT available for reporting on wallboards for now. |
|
The fixed range of the speedometer display type is from -100 to +100 |
The range of the Speedometer is updated from -100 to +100 (going from left to right, i.e. Red - Green). |
|
Any changes made to the dashboard configurations are not automatically reflected on the dashboard link |
Refresh the browser tab to reflect any changes that are made to the dashboard configuration (such as changes to the name, background color, company logo, dashboard gadgets (added, removed, updated)) |
|
Any changes made to the dashboard group configurations are reflected only on the browser refresh |
Any changes made to the dashboard group configurations (such as Auto-scroll flag, auto-scroll time changes) are reflected only on the browser refresh |
|
Gadgets are not resizeable |
Gadgets added in the dashboard are of the fixed sizes. |
|
Templates are not resizeable |
Templates are not resizeable. The user has to follow one of the fixed templates while creating a dashboard. |
|
Free Dashboard Design grid not available to create custom dashboard templates |
Dashboards can only be created following one of the predefined dashboard templates. Users cannot create customized dashboard templates for now. |
|
Large gadgets in small boxes might disturb the UI |
Avoid plotting the gadgets with large visualizations especially the Bar/Line charts and data tables on the dashboard templates having small boxes. |
|
Refresh the dashboard final link manually in case of a network glitch, |
In case of a network glitch, manual intervention is required to refresh the dashboard view |
|
Refresh the dashboard link to see updated or removed gadgets from the dashboard |
If the user changes or removes and adds another gadget in a dashboard while the final dashboard link is already opened in a separate window, the user would need to refresh the page to see the updated gadgets. However, the real-time stats are updated automatically without requiring to refresh the page. |
|
Refresh the final link to see the updated logo on the Dashboard fullscreen |
Refresh the final link of the dashboard to see the modified or updated logo on the Dashboard fullscreen. |
|
Dashboard Template once selected cannot be updated later |
Once the dashboard template is selected, the dashboard is created with a default name. The user cannot later change the template. To change the template, delete the dashboard and create a new dashboard with the desired template. |
|
Default data refresh rate is 5 seconds |
The application currently has the default data refresh rate of 5 seconds for each dashboard gadget |
|
Font colors and sizes of gadget titles cannot be changed |
You cannot change the font size and color of the gadget titles. The size of the title is adjusted automatically based on the screen resolution. Only the font color of the message text can be changed in the Text Message gadgets. |
|
If the data is null, gadgets are added without drawing the display types |
If the data is null, gadgets are added without drawing the display types (since there’s null data in the gadget) |
|
Statistics get refreshed when the Master node is shifted from one node to the subscriber node |
All the realtime stats are refreshed and the count starts from zero whenever the master node is shifted to a new Master. |
|
Data Service attribute tooltips are not translated |
The tooltips displayed for each data service attribute are not translated automatically. This is shown in the same language in which it was mentioned within the data service. |
|
The translation is only for the left to right languages |
The application supports language translation for all languages mentioned on the Languages Support page. You can place the translation file in the /root/wallboard/docker/translation folder with the name translation_code.json. The frontend should be restarted after placing the translation file in the translation folder. |
Solution Prerequisites
Hardware Sizing
The following lists the machine specifications for up to 100 concurrent agents deployment, with no other EF components installed on the VM.
|
vCPU |
vRAM |
vDisk |
Notes |
|
2 cores (2.60GHz, 2 processors) |
4 GB |
1x100 GB mounted on / |
In case MSSQL server is installed on a separate machine |
|
4 cores (2.60 GHz, 4 processors |
8 GB |
1x100 GB mounted on / |
If MSSQL server is installed on the same machine as the wallboard stack |
For HA, the same specifications would be doubled for two machines.
To get machine specifications for a larger agent volume and/or with other ExpertFlow products in a co-resident deployment, please get a quote from ExpertFlow or contact your ExpertFlow Account Manager.
Software Requirements
OS Compatibility
The following OS software is required on the server:
|
Item |
Version |
Notes |
|
CentOS
|
7.x updated to the latest packages (use Yum update) |
Administrative privileges (root) are required to follow the deployment steps. |
Database Requirements
|
Item |
Notes |
|
MS SQL Database Server 2016/2017 Express/Standard/Enterprise |
For clustered SQL Server installation, the customer will be responsible to provide the cluster. For stand-alone DB deployment, DB (2017 express) will be included within docker containers. |
|
Microsoft SQL Server 2017 |
Microsoft SQL Server 2017, Microsoft Corporation Express Edition (64-bit) on Linux (Ubuntu 16.04.5 LTS).
|
Docker Engine Requirements
|
Item |
Notes |
|
Docker CE 18.06.0+
|
Browser Compatibility
|
Item |
Version |
Notes |
|
Firefox |
73.0.1 (64-bit) |
|
|
Chrome |
Not tested
|
Some UI elements might not render properly. A full-blown testing cycle can be carried out on demand. |
|
IE |
Not tested |
Not supported |
Cisco Unified CCX Compatibility
Tested with the CCX version 11.5 and 11.6 Assumed to work on higher versions as well. An on-demand testing cycle can also be executed on older versions of CCX.
Cisco Unified CCE Compatibility
Tested with the CCE version 11.5. Assumed to work on higher versions as well. An on-demand testing cycle can also be executed on older versions of CCE.
Wallboard Reporting/ Display Device
The provisioning of reporting devices is partner/customer's responsibility. For reporting device, one of the following hardware solutions must be provided to display wallboard views in the production environment.
-
An existing PC with a pre-installed OS, Monitor or LCD for wallboard display OR
-
A Smart LCD with an embedded browser to open the wallboard view OR
-
A raspberry pi device with OS installed with an LCD to display.
For raspberry pi device's details, see https://www.raspberrypi.org/products/raspberry-pi-3-model-b/
Port Utilization
The following ports should remain open on the Firewall. The local security policy and any antivirus should also allow open communication on the following ports.
|
Type |
Source Host |
Source Port |
Destination Host |
Destination Port |
|
HTTP |
Enterprise web user |
any |
Dashboard & Wallboards |
80 |
|
HTTPS |
Dashboards & Wallboards server |
any |
Dashboard & Wallboards |
443 |
|
UDP/TCP |
Dashboards & Wallboards server |
any |
MS SQL Server (CCE DB) |
1433 |
System Access Requirements
Deployment Privileges
Administrative privileges (root) on the machine are required to follow the deployment steps. The Internet should be available on the machine where the application is being installed and connections on port 9242 should be allowed in the network firewall to carry out the installation steps.
Provision Database and a user on SQL Server Cluster
The following database and the privileged SQL user is required to connect to the application database. The application will create its tables and other schema objects itself after connection.
-
Create a wallboard application database with the name EFWallboard.
-
Create an SQL Server User EFUser with a database role db_owner on the EFWallboard database.
Integration with UCCX
To read CSQs and agents list from CCX, we need admin user credentials to access UCCX Configuration APIs to fetch the list of CSQs, agents, and teams.
To access the Cisco CCX database remotely via the wallboard application, CCX reporting user (uccxhruser) password is required.
Integration with UCCE
Since we need access on the Cisco AW database remotely, create an SQL server user, EFUser, with db_datareader role on the Cisco AW database.
Time Synchronization Requirements
If the system dates and times are not synchronized, the system can produce unpredictable results. Therefore, the EF applications and Cisco Contact Center should have their time zone and date/time properly configured, according to the geographic region and must be synchronized.
To configure the time zone, please see the instructions from the hardware or software manufacturer of the NTP server. The application servers should be synchronized. This synchronization should be maintained continuously and validated on a regular basis. For security reasons, the Network Time Protocol (NTP) V 4.1+ is recommended.