Table of Contents:
PCS allows managers to run customer satisfaction surveys following their interactions with the call center including interactions through voice calls and web chats.
Surveys through the following channels are available as of today:
-
IVR surveys: An IVR-based questionnaire can be played to a customer over the same incoming call once the customer ends up talking to the contact center representative.
-
SMS Surveys: As a replacement to IVR surveys, an SMS message can also be sent to take quick customer feedback after an inbound call ends.
-
Web Survey: A Web-based survey can be pushed to the customer at the end of a webchat. Note that PCS exposes RESTful APIs for 3rd-party chat engines to trigger a web survey automatically at the end of a webchat.
A Contact center can run multiple surveys of different types simultaneously for different services and DNs (Dialed Numbers).
Logging in
An admin is the primary user of the system who has access to complete system features.
Log in with the super admin credentials as provided by ExpertFlow. You may later change the passwords of the system.
Username: admin
Password: admiN123!
If you face any issues during login, please contact Expertflow Support.
Setting Up PCS
License Information
Go to the admin -> License Information menu to see your license information.
The License Registration page appears with the details about the installed license:
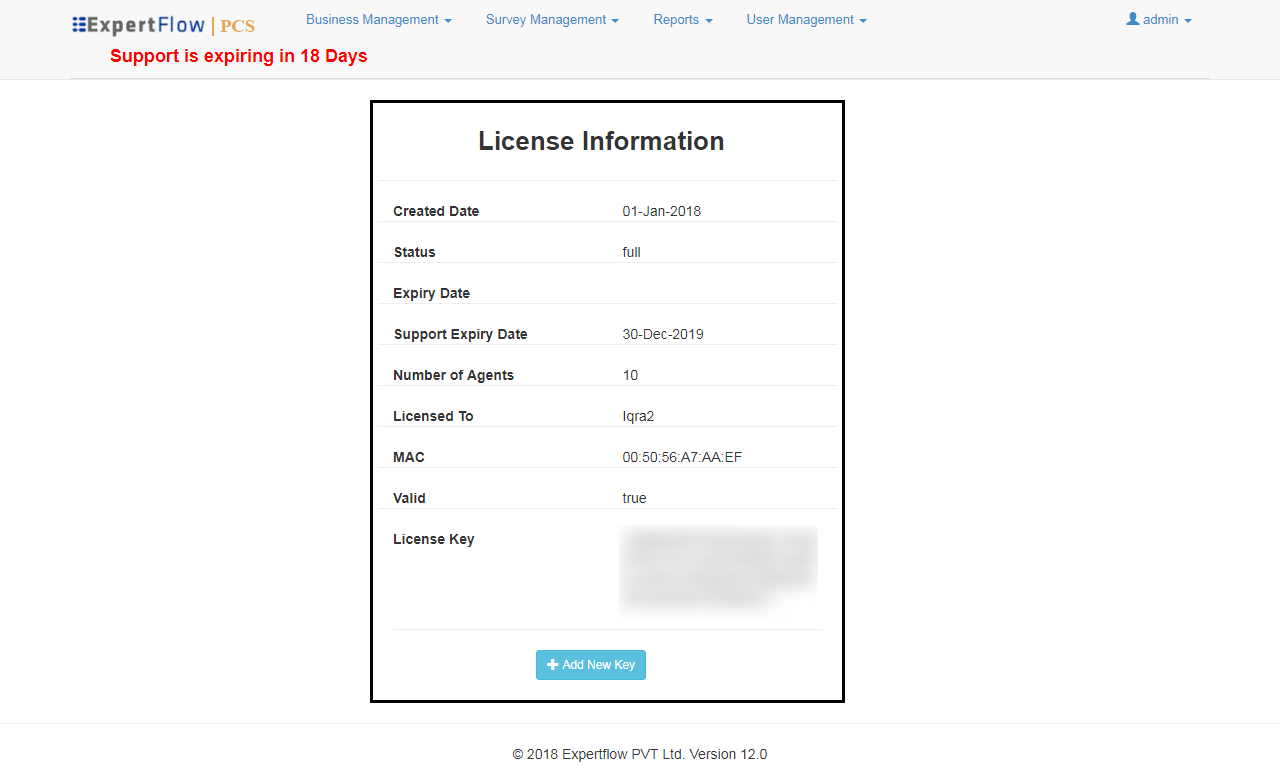
As can be seen in the screenshot above, the Created Date and Expiry Date fields show the date when the license got installed and the date when it will expire.
The application starts showing a reminder one month before the support contract expiry to renew the contract to continue to enjoy the uninterrupted support from ExpertFlow.
Settings (for CCE)
Settings are specified to define the location from where to synchronize the audio prompt files which are used in PCS IVR surveys. This setting should be configured only in the case of UCCE-based deployment.
In the case of CCX, the audio prompts are synchronized from the CCX server directly via APIs.
Skip this section if you have Cisco Unified Contact Center Express (UCCX) deployment.
Proceed to the Settings menu through admin → Settings.
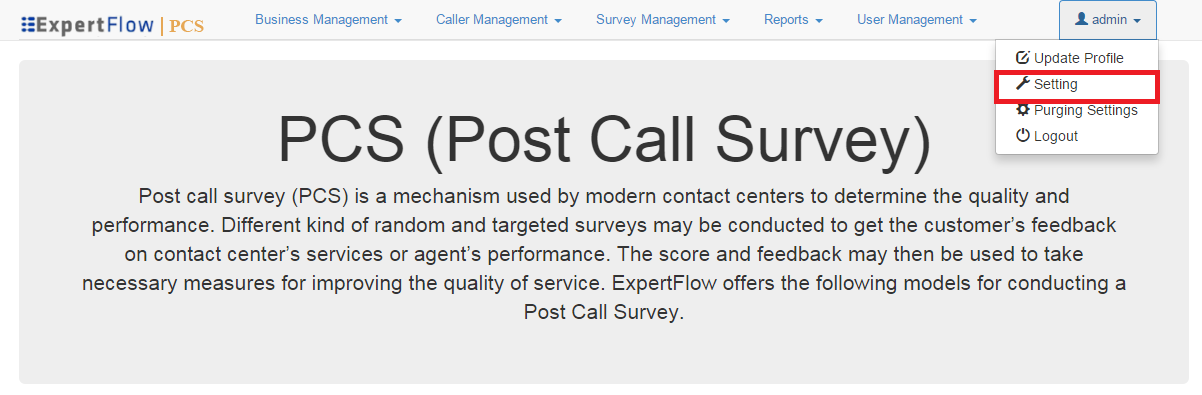
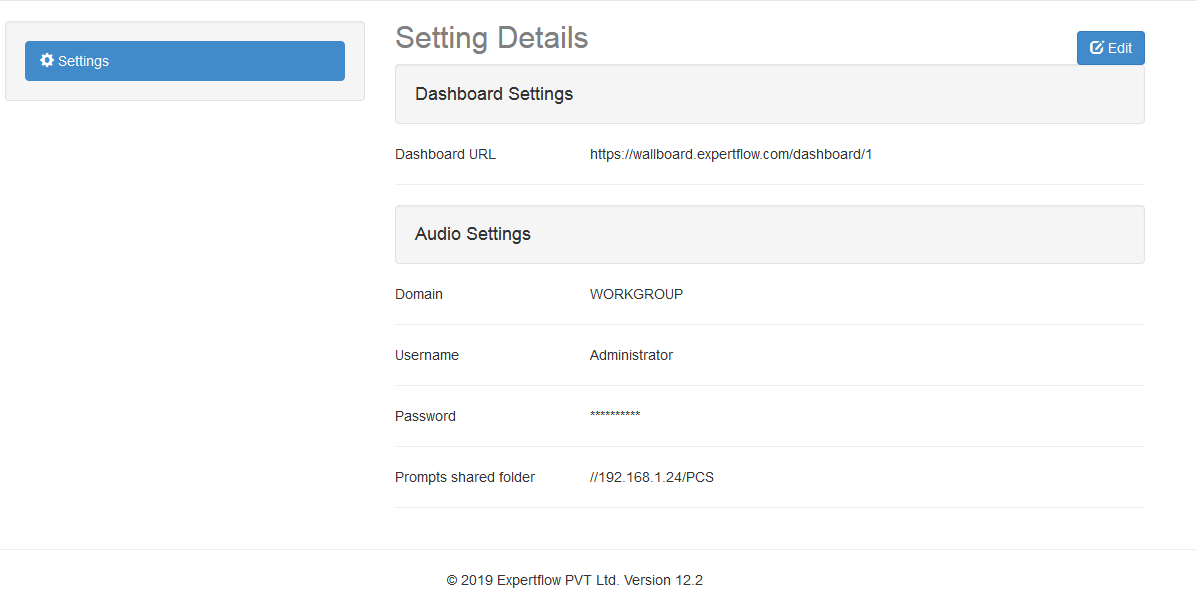
Under the Setting Details page, you will see the following parameters:
Dashboard Settings
-
Dashboard URL: The URL of the Dashboard or Dashboard group is located here. this should be a valid dashboard URL link.
Audio Settings
-
Domain: This is the domain of the machine where prompts are located
-
Username: This is the username of the machine to be accessed for prompts retrieval
-
Password: This is the password of the machine to be accessed for prompts retrieval
-
Prompt Location: This is the complete path of the location where the audio prompts are located
-
File Path: When a survey is played to the caller, we can also enable/disable an option for the caller to record his feedback while providing the response to survey questions. This field stores the path where the recorded voice feedback of the customer should be stored.
Business Management
Under Business Management, you can synchronize contact center agents from UCCE/UCCX database. These agents are then used in reports to filter survey records against particular agents.
Agents
Go to Business Management→ Agents menu to view agents list.
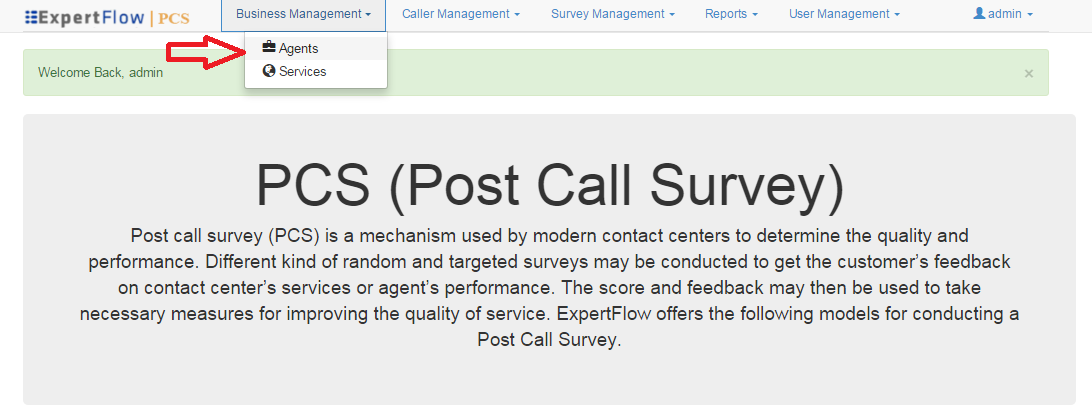
You will see Agents List as shown below with read-only rights:
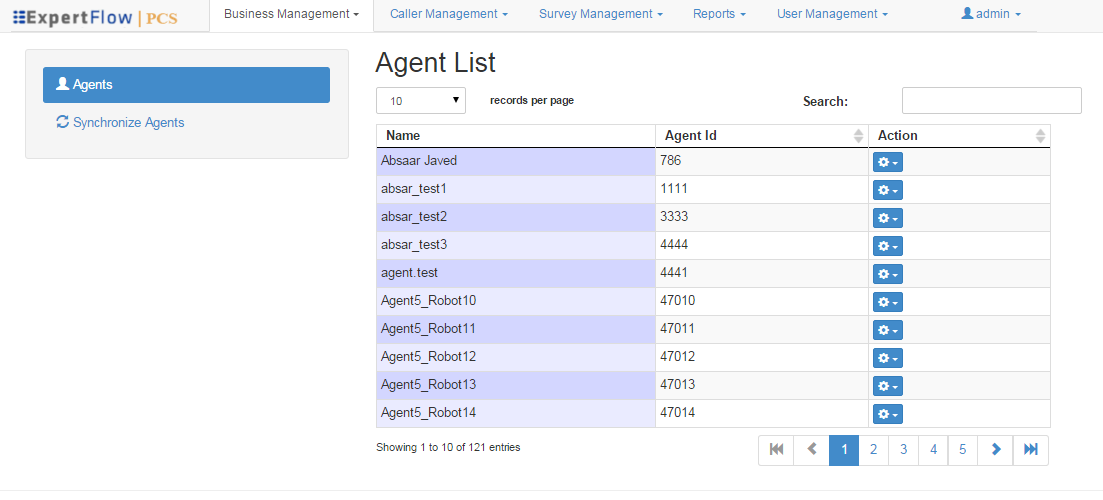
Click Synchronize Agents link to get the latest updated Agents List from CCE/X.
-
In the case of CCX, the agent synchronization sometimes takes a bit longer.
-
If agents are edited from CUCM in the case of CCX, the changes might not reflect properly in PCS.
-
The same agent's information is used while reporting on the survey statistics.
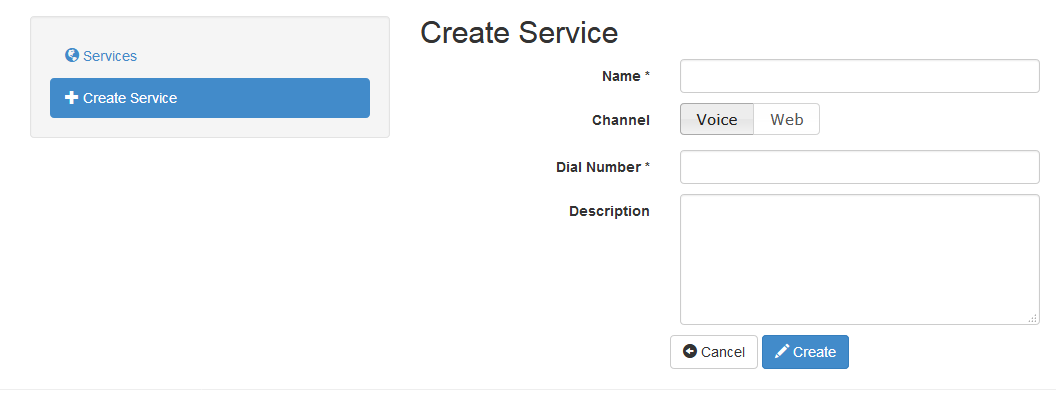
Services
Services in PCS act as triggers to hit the survey script at the end of the interaction. These services are associated with the surveys which run at the end of customer interaction.
A new Channel field allows differentiating between Web and Voice services. For a voice survey, the user can provide Dialed Number, the name of the service and provide an optional description whereas, for a web survey, the user can provide the service name and optional description for which this survey is going to be executed.
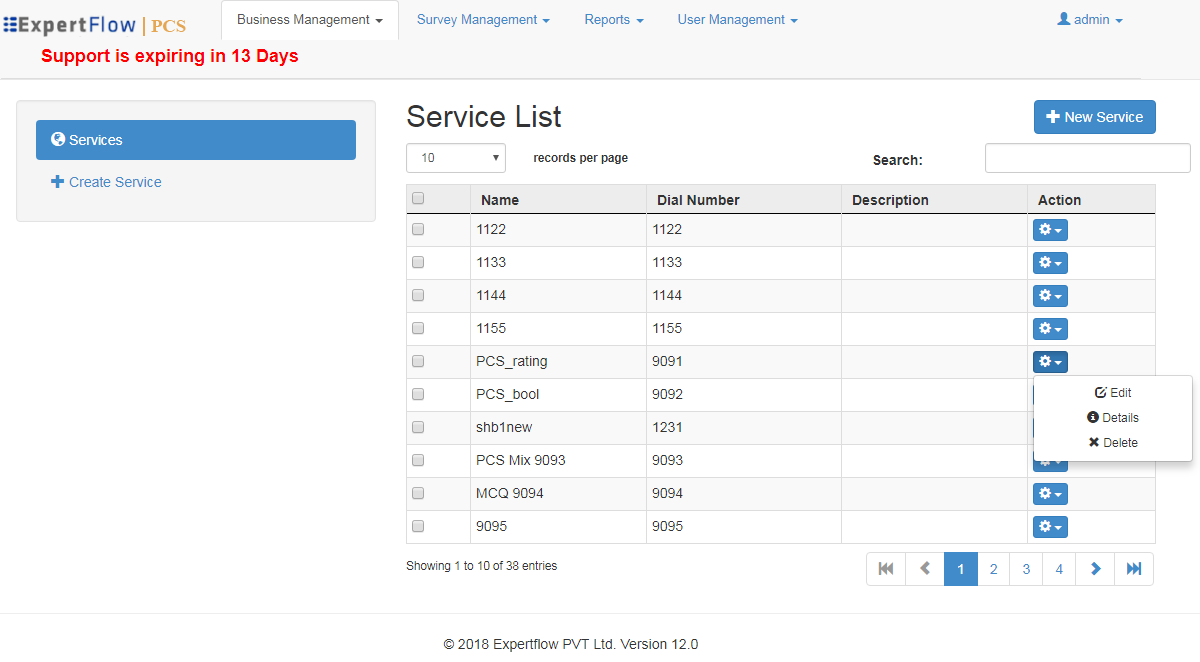
Go to Business Management→ Services menu to view the Services list.
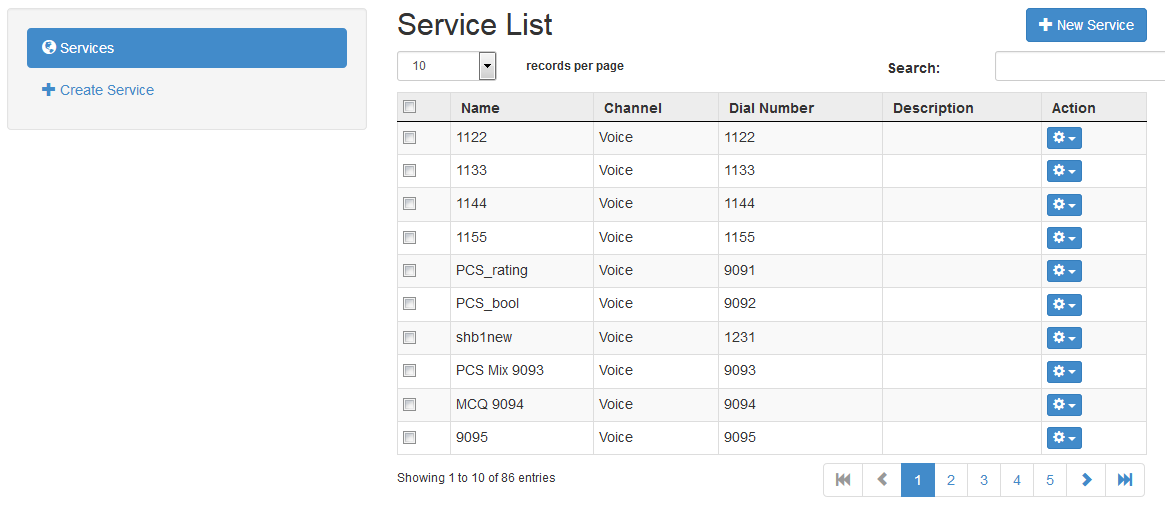
Click the New Service button to add new contact center service.
See Actions drop-down to make changes to any service later on from the Services List.
Survey Management
Questions management
The Questions management feature allows you to create and manage your survey questions. The questions are the audio files in case of IVR survey, SMS text in case of SMS surveys and textual questions with several rating or two boolean options in the case of web surveys.
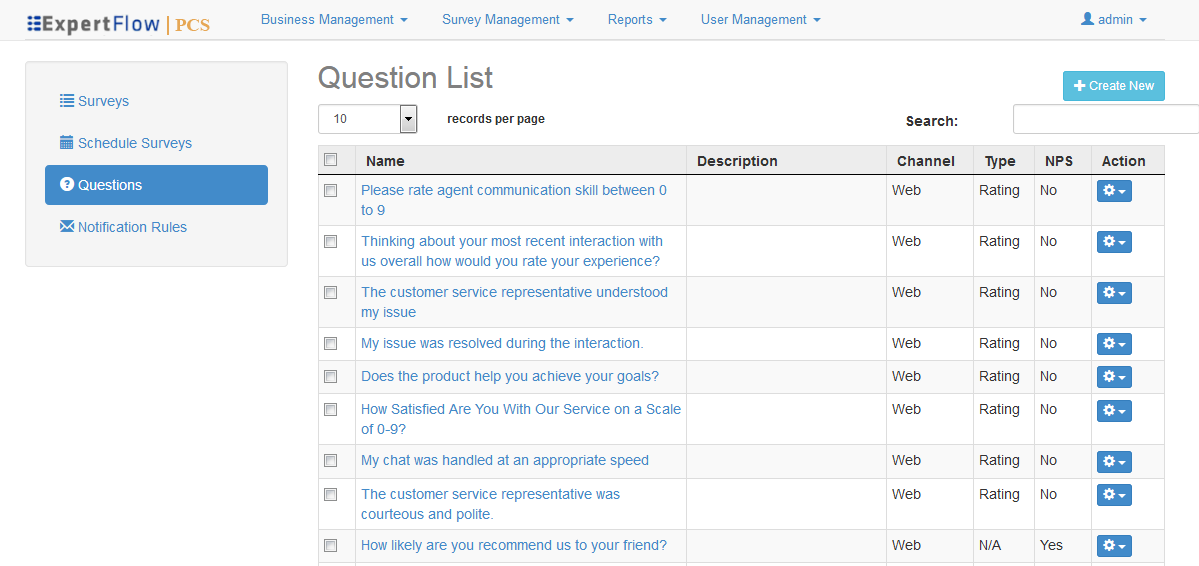
Go to Survey Management → Questions to access the Questions list.
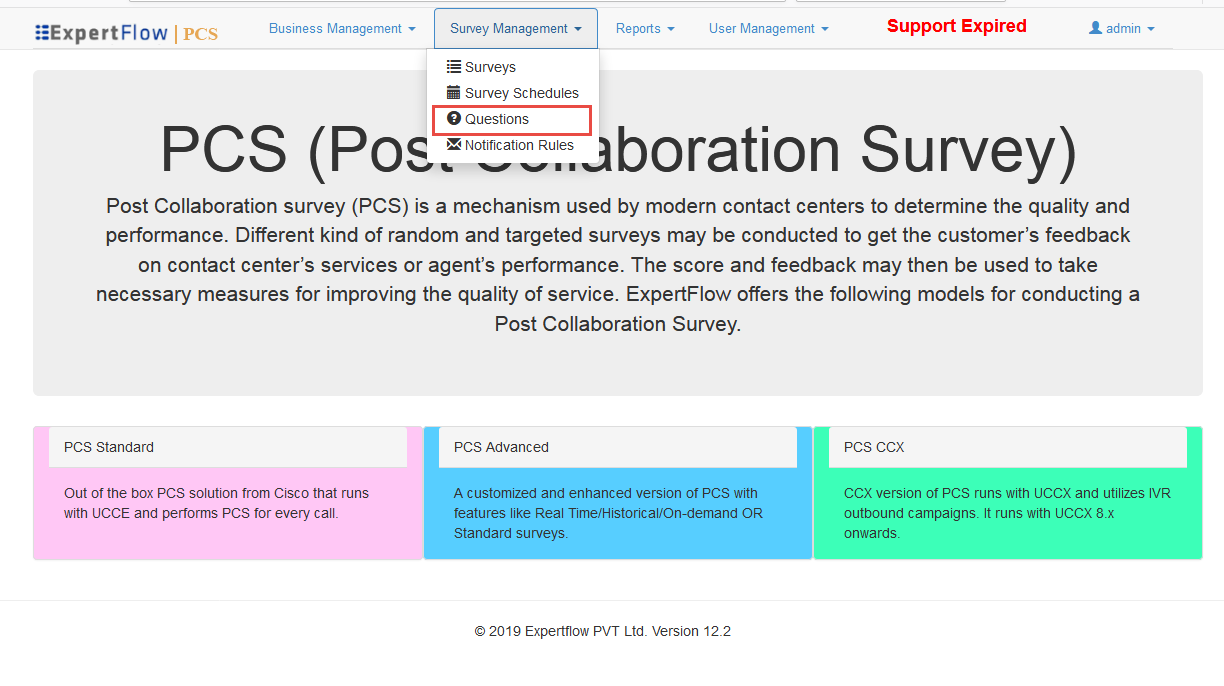
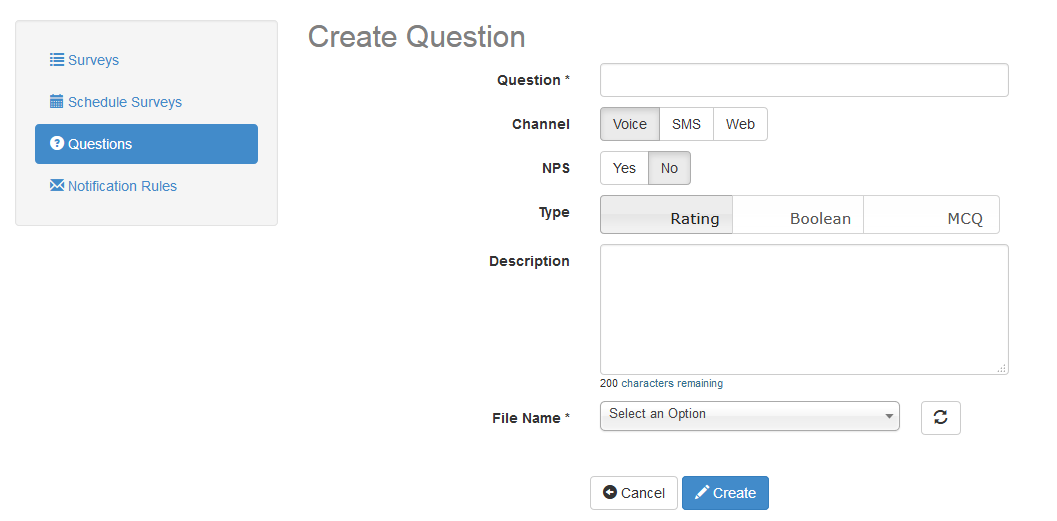
Click the Create New button to create a new question.
Fill the form using the following table:
|
Name |
Description |
|
Question |
Enter the question. This serves as the name of the question in case of IVR and SMS -based surveys while shown as a textual question to a web surfer in case of web-based surveys. |
|
Channel |
Choose the channel type for the question. Based on the selection, the appropriate parameters are displayed. |
|
NPS |
For a survey that has to generate an NPS report, it has to include a question of type NPS in the survey. While creating an NPS question, set this flag to “Yes”. An NPS question always has a rating scale of 1-10 no matter what rating scale has been configured on the backend. So the rating scale selected in the application configuration (i.e. 1-5 OR 0-9) is applicable to all non-NPS questions across all PCS surveys. Check with your system administrator to know what rating scale is being configured in the application. |
|
Type |
Choose the type of question. Note that a question can be one of the following:
|
|
Description |
Enter a brief description about the question. In the case of SMS question, write here the SMS message that is to be sent to customers at the end of the call. |
|
Options |
This field is only shown if the WEB channel is selected. These are the multiple different textual options that you would like to provide to the customer. Note that in the case of having Rating type questions, there is a predefined rating scale from 0-9 or 1-5 (as configured in the application backend). So, the options in this field in case of Rating type questions are only to define the minimum, maximum range; i.e. Bad or Good. In the case of Rating type questions, you always need to provide a negative option on the first index and the positive option on the second index. To learn more, see Submit feedback from web section. In the case of Boolean type questions, you always need to provide a positive option on the first index and the negative option on the second index, (i.e. the sequence must be, “Yes, No” OR “Agree”, “Disagree”).
|
|
File name |
This is the audio prompt that should be played in the IVR and is only shown if the channel of the question is Voice. |
You cannot edit a question once created and linked to a survey.
Creating a survey
PCS allows users to create as many surveys as desired.
Go to Survey Management → Surveys tab to access Surveys List page.
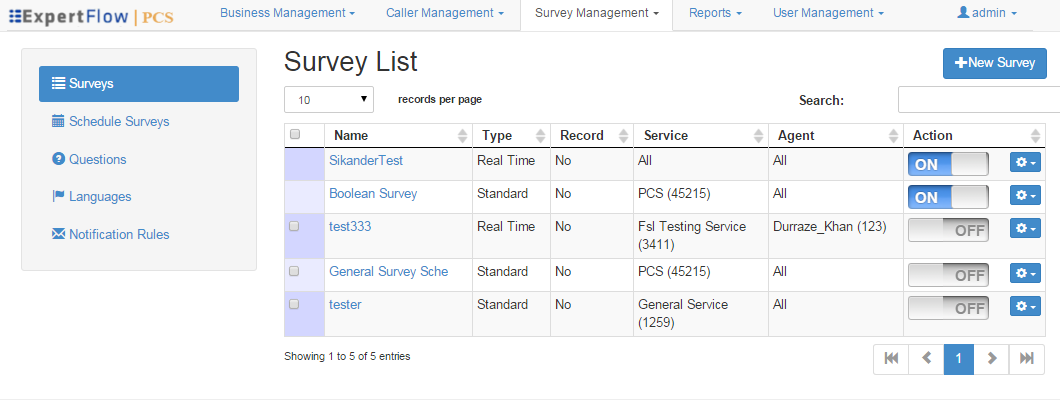
Click the New Survey button to create a new survey.
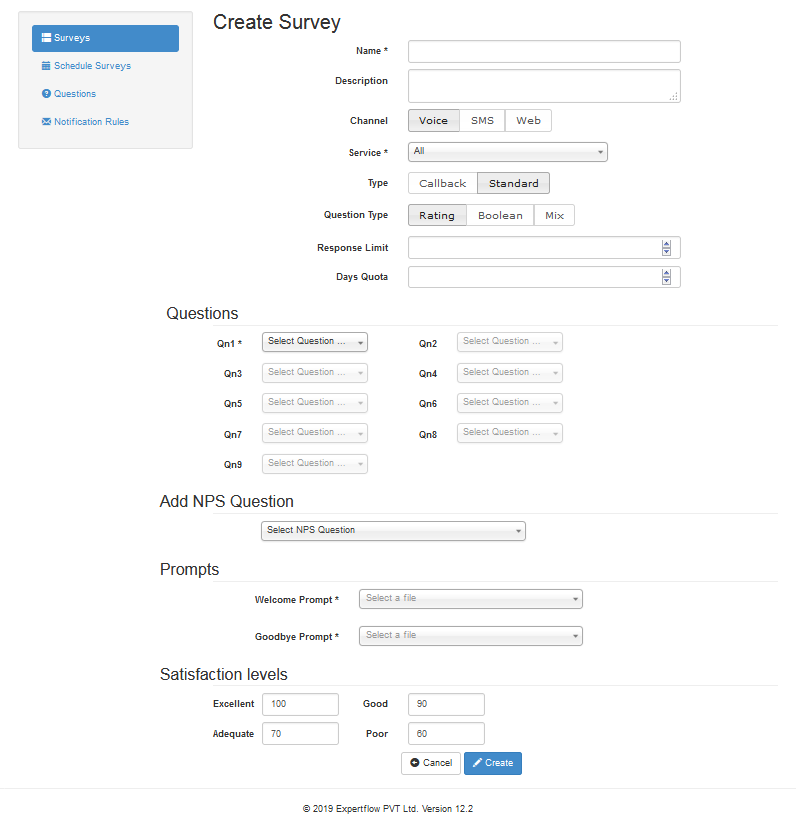
Under the Create Survey form, give the details to the survey as the following:
|
Name |
Description |
|
Name |
Enter the name of the survey. |
|
Description |
Enter an optional description. |
|
Channel |
Select the channel through which the survey is to be conducted. |
|
Service |
Select one service DN, i.e. the trigger to hit this survey. Note that to run a web and SMS survey with all services, select “All-Web” in the case of web survey and “All” in the case of SMS surveys. For Surveys, one service can be used in multiple surveys however one Survey is on related to that service. For UCCE-based deployments, surveys can be created with All Services except for the surveys of type “Standard”. |
|
Question Type |
The question type also determines the survey type. So if you select Rating, the survey is supposed to contain rating-type questions in it, hence called, a Rating type survey. The questions in Questions dropdowns appear based on the question type selected here. |
|
Response Limit |
“Response Limit” text field determines the maximum number of responses to be collected in a survey. Maximum limit of Response Limit is 9999999. |
|
Days Quota |
The admin also defines the number of days for the renewal of the survey quota in a "Days Quota" field. Maximum limit of Days Quota is 9999. |
|
Questions |
Select survey questions one by one. At least, one question is required to be present in a survey. 10 questions can be defined in a survey at max with 10th question being the NPS question. |
|
Agent |
Always select “ALL” agents for voice and web surveys. For SMS surveys, select the name of the agent against whom you want to conduct the survey.
|
|
SMS Question |
Choose the SMS question to be sent to the customer at the end of the call. This is the question that has been created through Questions interface. This field is shown if the selected survey channel is type SMS. Note that in the case of SMS surveys, we can only send one question in an SMS survey. |
|
Type |
Type of the survey could be Standard, Callback. In Standard surveys, we do have the ability to play the survey on the same call after agent hangs up the call while in Callback Surveys, an outbound survey call is generated once the customer call ends. This field is only shown in case of UCCE-based deployments. In the case of CCX, there’s only one type of survey which is “Standard” (happens right after the customer interaction) |
|
NPS Question |
NPS stands for Net Promoter Score. It's a customer satisfaction benchmark that measures how likely customers are to recommend your product to a friend, family or colleagues. It is a typical answer to a question like "On a scale of 0 to 10, how likely are you to recommend us to a friend?" The responses to this question can be categorized into three groups:
|
|
Prompts |
Select Welcome and Goodbye prompts for voice-based IVR surveys. If the selected survey channel is SMS or Web, these fields will not be shown. |
|
Greeting Message |
In the case of Web Survey, the user can define the greeting message for a particular web survey. This message appears on the top of the web survey form |
|
Goodbye Message |
In the case of Web Survey, the user can define the goodbye message for a particular web survey which appears after the survey feedback is submitted by the customer |
|
Satisfaction Levels |
Set customized satisfaction levels based on business requirements. By default, if the survey results are 100%, this would be marked as Excellent, if it is greater than and equal to 90%, the survey result would be marked as Good and so on. |
Once a survey is created, its default state is OFF. You can start/stop a survey at any point in time. Once a survey is turned ON, it can not be edited. The only operation which can be performed against an already running survey is to set up notification rules. See Setting up Notification Rules section for more details.
Proactive IVR/SMS Surveys
Running a survey proactively allows you to instantly make fresh outbound calls or send the survey SMS in bulk to a list of customers at any time. You can add customers in a list whom you think are/could be the eligible participants of the survey and upload the list to an ExpertFlow Campaign Manager campaign. From the ECM campaign, select this campaign to run as a survey campaign. ECM calls PCS APIs to trigger the PCS IVR or send the SMS via PCS. The response to the survey is then collected and available for reporting from the PCS Database.
-
This feature is tested/available only for CCE deployments.
-
This feature requires integration with ECM.
-
Since only IVR-based surveys can run from PCS, Cisco OB IVR licenses required to run Proactive IVR or Callback surveys from PCS.
-
To execute proactive surveys, the allowable file size of contacts CSV is 128 KB
-
To run proactive surveys or targeted surveys on a customer list, upload the customer list to an ECM campaign.
The other actions against an existing survey include Edit, Delete, View Details, Add Schedule, View Schedule of the survey. To see how to add a schedule to a survey, see Setting up Survey Schedules section.
For a Web survey, you can also preview a created survey by going to Actions -> Preview option.
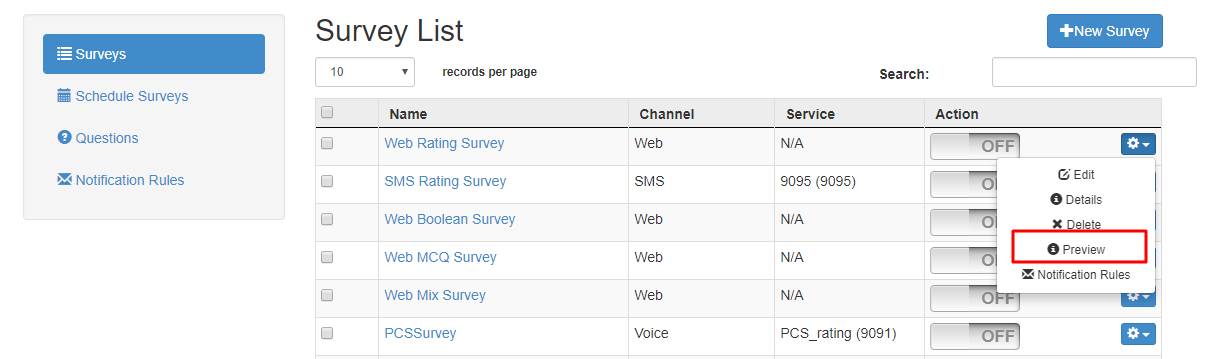
The option allows you to see how the web survey will look like as a final web form.
-
One survey can be ON against one or ALL services at a time.
-
A survey cannot be created against multiple services.
-
Rating range for rating type surveys (i.e. 1-5 or 0-9) is defined in the deployment time and set by the EF IT team.
-
Surveys should remain turned ON to continue to collect customer responses in the survey
-
A survey once created cannot be modified to add/remove questions from it. The user can, however, modify the survey Name, Description and the Satisfaction Levels of an active survey.
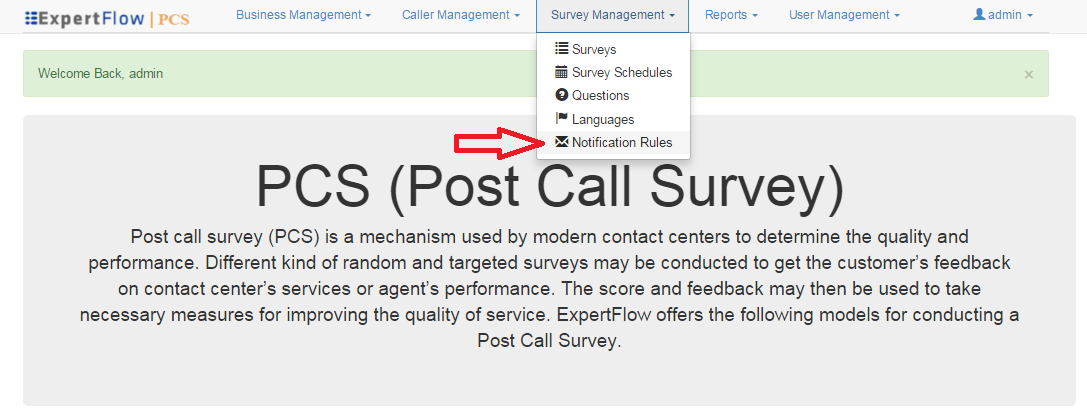
Setting Up Notification Rules
Survey notification rules allow you to create email notification rules for a voice-based survey. These rules can state for example, if the average rating of a particular survey goes below 40, generate an alarm by sending an email to a contact center supervisor. This email will include the survey on which the alarm is triggered, the service/DN, the calling number (customer’s phone), the feedback time and the average rating provided.
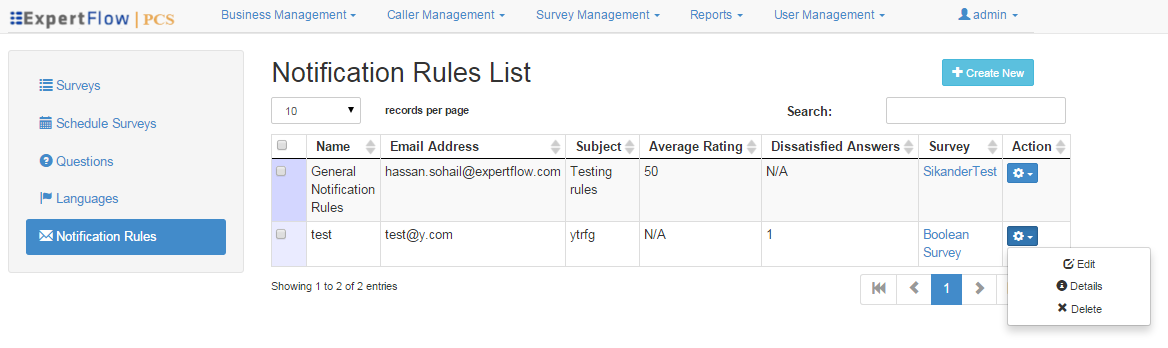
To set up notification rules, go to Survey Management → Notification Rules tab from header. You can also select an existing survey and add notifications rule against it by expanding the Action menu in Survey List.
Click the Create New button to create notification rules on Notification Rules List page.
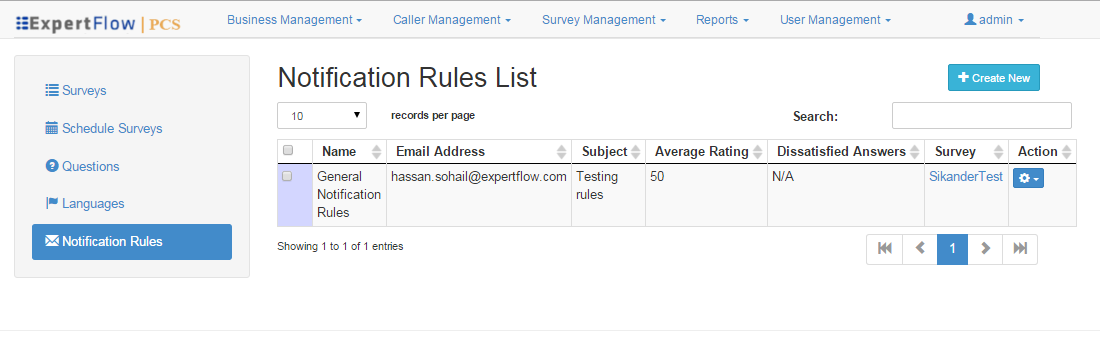
On Create Notification Rule page, enter the following information:
-
Dissatisfied Answers: This allows to enter the number of dissatisfied answers in this survey so if this number is met, an alarm should be generated and/or notification email must be sent. This field only appears if the survey selected from the Surveys list is a Boolean type survey.
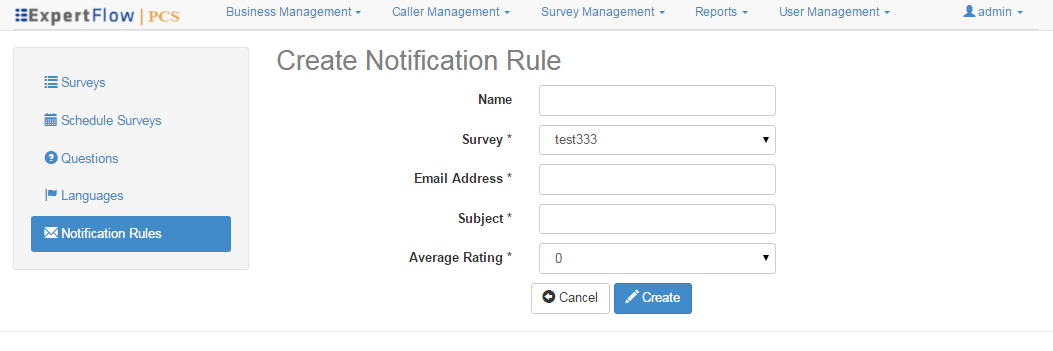
Click the Create button to save the rule.
You can also see permissible actions (Edit, Delete, Details) against a notification rule by expanding the Action menu in the Notification Rules List.
-
The email notification rules are not applicable to Web surveys.
-
Text of the email notifications cannot be customized at the moment. For now, the only information added in the email is the name of the survey, the service/Service number/trigger associated to the survey script, the customer phone number and the agent (against whom the survey was created). Since email notifications only work for voice surveys, the text in each email is set to Agent: All Agents at the moment (as for voice surveys, they can be run for all agents and not for a particular call center agent)
-
Notification rules are sent only when the result of the survey goes BELOW a predefined threshold (i.e. either below “average rating” OR the number of “dissatisfied answers”).
-
Email notifications can only be sent to one email address at the moment.
Setting Up Survey Schedules
You can also set survey schedules against a particular survey. Schedules can be set for both “Standard” and “Real-time” surveys.
Go to Survey Management → Survey Schedules tab from header. You can also add a schedule to an existing survey (only if the survey is turned OFF).
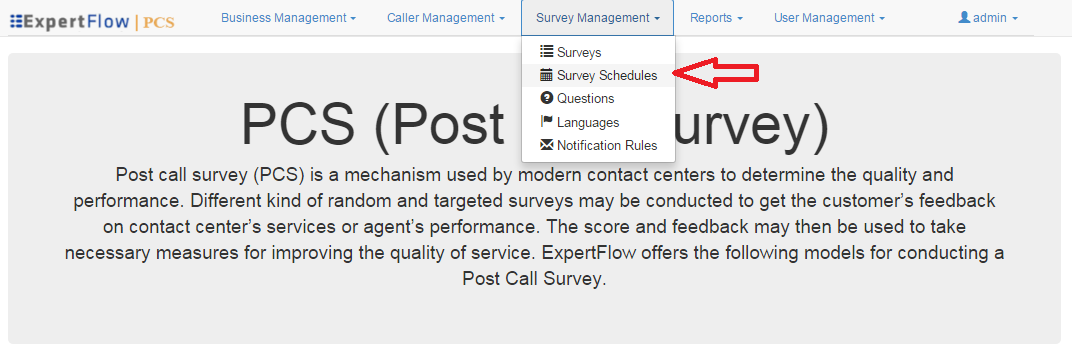
Click Create New button to create a new schedule.
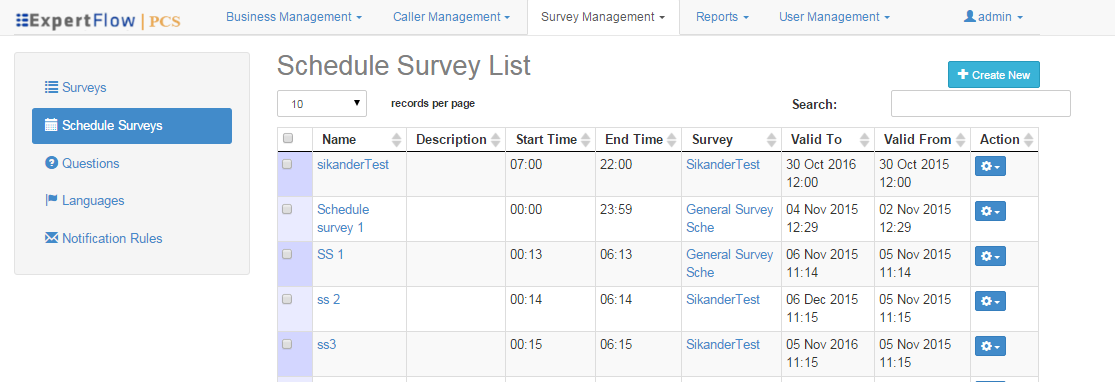
Under the Create Survey Schedule page, provide the following information:
-
Name (mandatory): Give a name to the schedule.
-
Description: Give a short description of the survey schedule.
-
Survey (mandatory): Select a survey for which this schedule is to be created.
-
Repeat: Give a recurrence type for the schedule. The currently available types are Daily, Weekly, Monthly, Yearly. Select No if recurrence is not required.
-
Start Time (mandatory): Give a start time of the schedule.
-
End Time (mandatory): Give an end time of the schedule.
-
Valid From (mandatory): Give a valid from the date from which this schedule would become effective.
-
Valid To (mandatory): Give a date until when the schedule remains active.
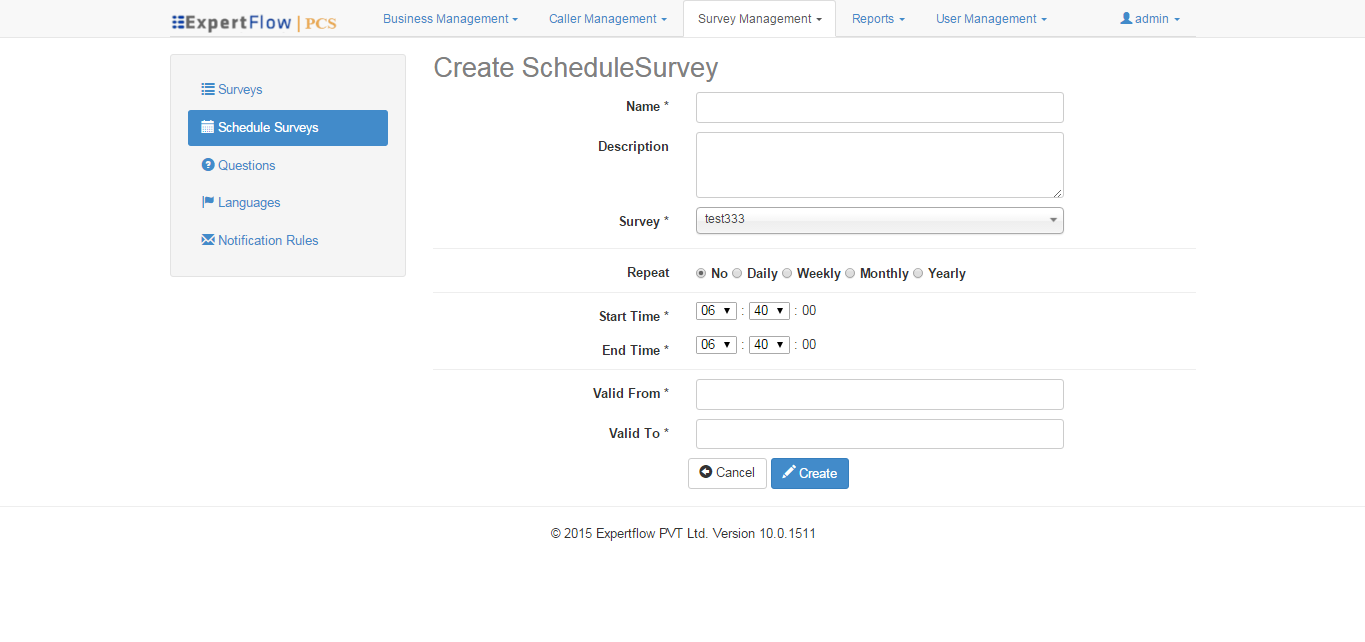
Click the Create button to create a survey schedule.
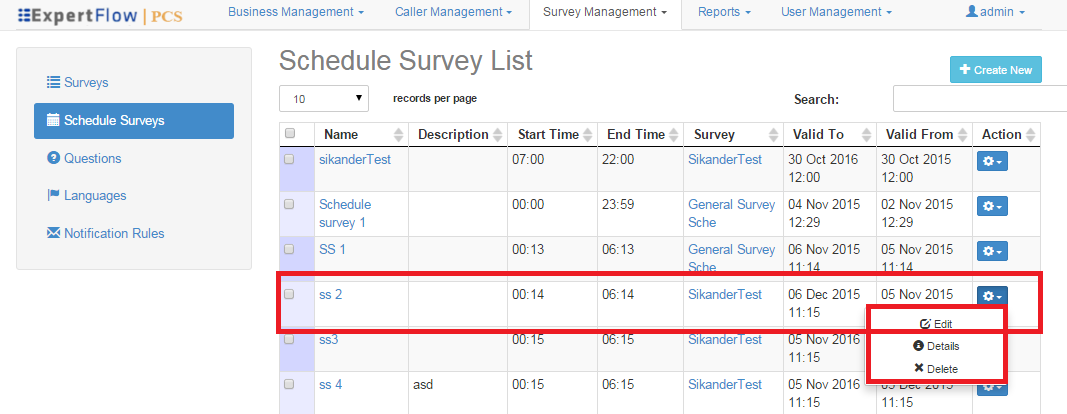
To see possible actions against an already created survey, select the survey under Survey List and expand the Action menu under it.
-
Once created, you cannot change the survey to which it is associated.
-
You cannot create survey schedules for web surveys.
Making configurable the order of the survey rating scale
The rating scale available within the app runs in a sequence with 1 being the highest negative and 5 being the highest positive (in 1-5 rating scale) or 0 being the highest negative and 9 being the highest positive (in 0-9 rating scale), in configurable rating scale1 being the highest positive and 5 being the highest negative. In the same order you can apply to the other rating scale, i.e. 0-9 (0 being the highest positive and 9 being the highest negative).
In the configuration settings, the deployment engineer (or customer) will be able to map the worst and the best rating with the highest or the lowest number. This will apply to both 1-5 and 0-9 to rating scales for all surveys. For instance, you can map the worst rating score to the highest number on the rating scale (i.e. 5 in case of 1-5 rating scale) while mapping the best score to the lowest number (i.e. 1 in case of 1-5 rating scale). Similarly, it can also provide the opposite of it.
This will be a one-time configuration, as other settings in configuration settings. If it is changed later in production, it might effects reports.
In the PCS configuration settings page, right below the Rating range options, there is an option for this proposed settings with label Best Rating with two options 1. Highest number 2. Lowest number
By default, the Highest number will be selected.
There will be changes in Summary and average reports and Email notifications averages calculations.
This does not apply to the rating scale of NPS which is the standard rating scale with 1-6 being detractor, 7-8 passives and 9-10 being the promotor scores.
Web Survey Feedback Form
This is a static form developed by ExpertFlow which generates questions dynamically based on the survey configured. If there are multiple web surveys, the application checks which particular web survey is active at the moment (only one web survey can be turned on at any time). The third-party chat application is supposed to call PCS APIs at the end of the chat so that to populate a web survey automatically as soon as a webchat ends.
Survey Form Responsiveness
The form is responsive so that the user can open it from his mobile device in any mobile-supported browser.
The following browsers are supported;
-
Google Chrome
-
Safari (for iOS)
-
Opera
-
Mozilla Firefox
The minimum screen size on mobile is 320*480 and maximum 768*1024
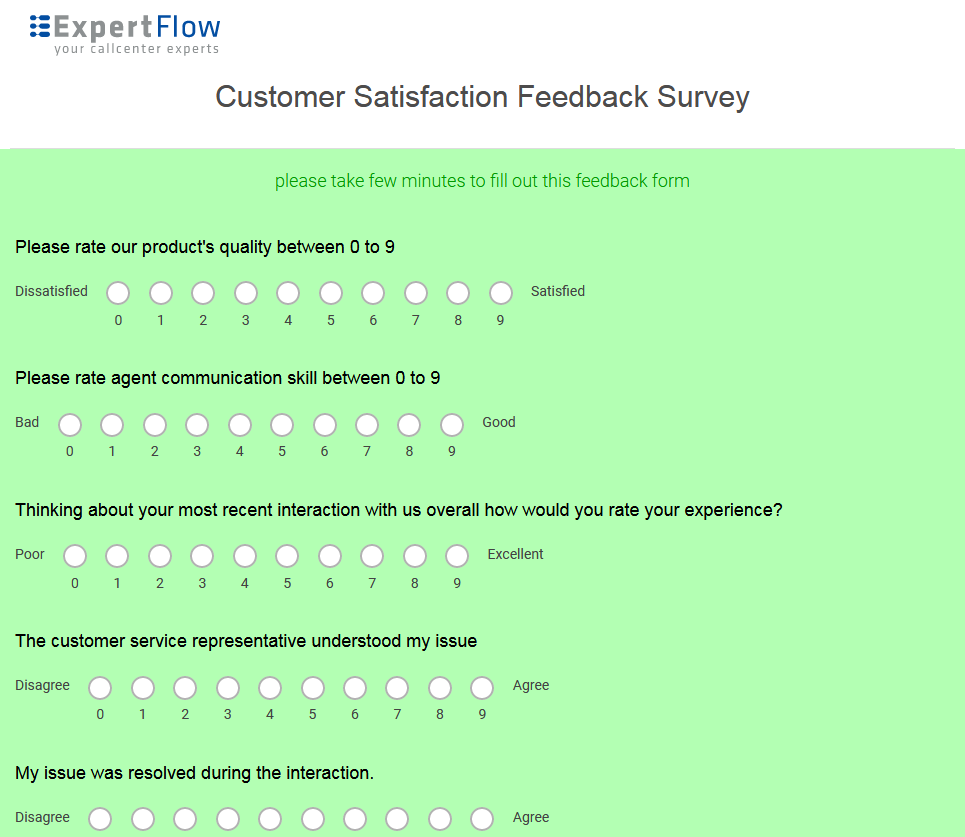
Customize Survey Form
This provides the ability to customize the UI of the customer-facing survey form. For instance, add company logos on the form, change fonts and colors.
Following is the list of areas which the customer can customize in the natively available survey form in PCS:
-
Company Logo: Placeholder for the company logo. The image or logo size should at least be of size 200 X 200 and should be in SVG format.
-
Header text: This is a string to greet the customer such as “Thank you for visiting EF website”
-
Header Color: Font color of the header text
-
Message text: A brief text shown after the header and before starting the questionnaire, for instance, “Dear<customer name>, Thank you for speaking to <agent name> today. Please fill out the form below to tell us about your experience chatting with the staff”.
-
Message text font color: This is the font color of the message text.
-
Page Background color: Customizable page background-color
-
Button caption font color: This determines the color of the button caption font
-
Button background color: This determines the button background-color
-
The survey questions in the form will render with their default styling and font colors.
-
The survey form can also be customized completely while fetching the survey questions via PCS survey APIs to show it on the customized form and push the feedback to the system using the surveyFeedback API.
Reports
There are some standard survey reports built-in within the PCS application whereas, some reports are also available in CUIC to see detailed statistics, summary statistics and graphical reports to show the summary of customer responses.
To access the built-in reports, click the Reports link from the header.
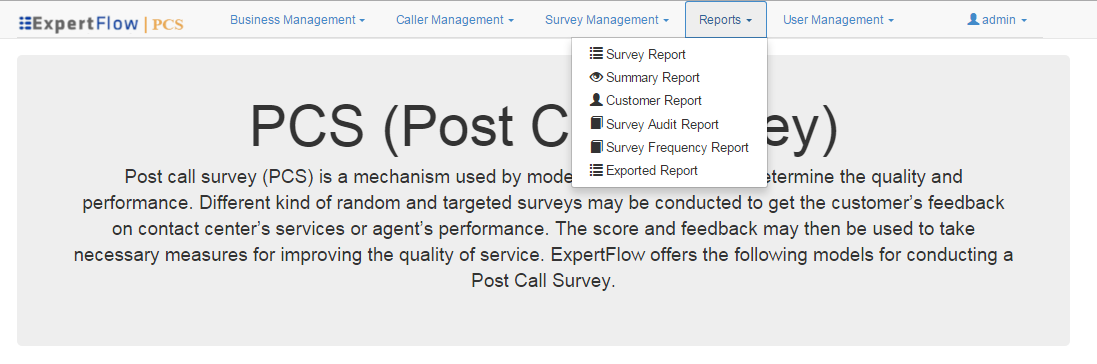
The following reports are available:
|
Report Name |
Description |
Available in PCS |
Available in CUIC |
|
Survey Detail Report |
Gives detailed statistics of each survey call |
||
|
Summary Report |
Gives summary statistics of each individual question in the survey for all calls happened on the survey. Provides two variations when seen within CUIC:
|
||
|
Average Report |
Gives the average calculation of the survey results on i) the individual survey calls and ii) an overall calculation of all calls happened on the survey |
No |
|
|
Customer Report |
Gives the same detailed statistics of the survey calls as in the Survey Detail Report with a special search filter on customer name/ANI/ID |
No |
|
|
Survey Audit Report |
Gives the user audit report with activities done by the user, the name of the user who performed an activity and the time when the activity was performed. It mainly reports on the “Start” and “Stop” survey activity done by a user. |
||
|
Survey Frequency Report |
Reports on the number of times a survey is answered for each individual survey along with a maximum number of questions answered by customers in the survey |
||
|
NPS Response Volume |
This is a graphical report which shows the data distribution of Promoters, Detractors, and Passives on a bar chart for a survey |
No |
|
|
NPS Score Report |
Detailed statistics with the NPS score calculation and detailed statistics of the number of promoters, detractors, and passives against each NPS score |
No |
Survey Detail Report
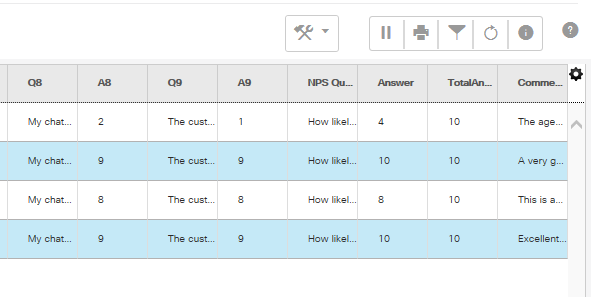
This report gives details about a survey, such as the Survey Name, Agent Name, Caller ANI, Time when the survey was played, the questions and the answers to the question provided by the customer.
Select the survey channel Voice, SMS, WEB to get appropriate survey results.
Select the survey from Select Survey drop-down and select a date/time range to filter results based on the given time period. Click after selecting the criteria.
In the Survey Detail report, the following information will be shown to the customer.
|
Name |
Description |
|
Name |
Enter the name of the survey. |
|
Agent |
The name of the agent who answered the call. |
|
Customer |
This would show customer email in case of web surveys. In the case of voice/SMS surveys, this column would show the customer phone number. |
|
Time |
This is the date and time when the feedback is submitted. |
|
Q1-Q9, NPS Question |
The columns show the questions configured in the selected survey. |
|
A1-A9, Answer |
The columns show the answers provided by the customer to the given questions. |
|
Message |
Contains the survey message text. Shown only if the SMS survey is selected in the filters |
|
Response |
Contains the customer feedback message in response to the survey text message. Shown only if the SMS survey is selected in the filters |
|
Total Answered Questions |
This column shows the total number of questions that were answered by the customer. |
|
Comment |
A comment box to record customer’s comments to summarize his experience |
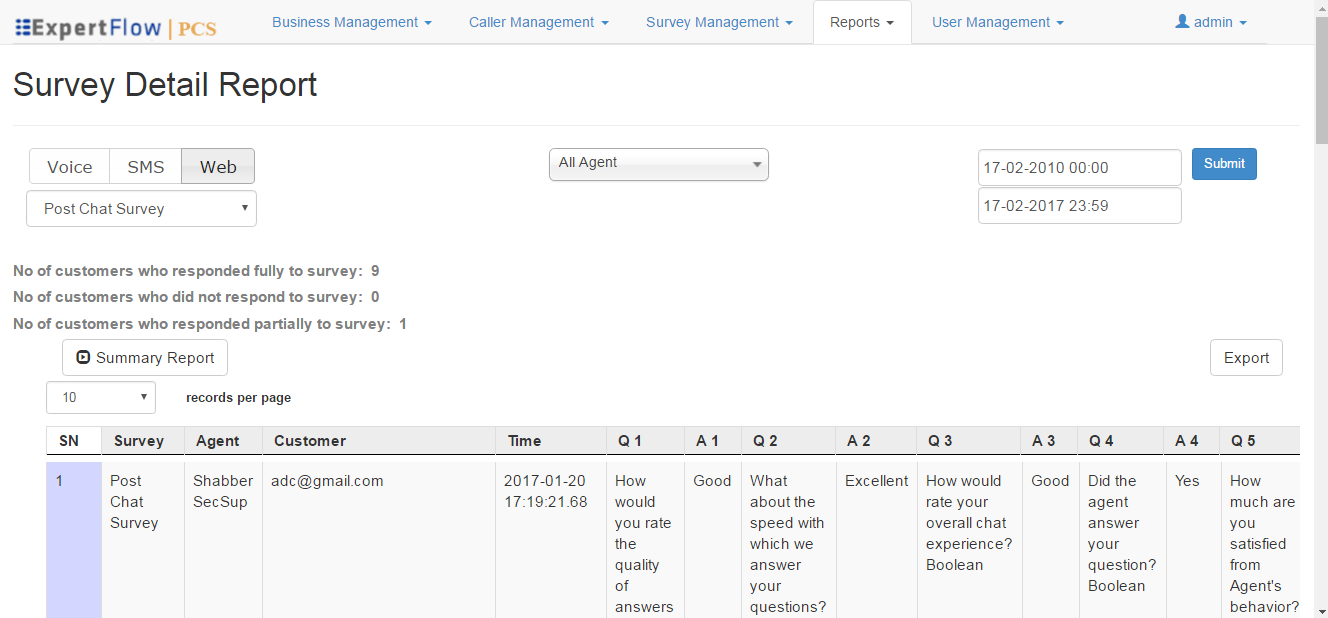
To provide summary stats, the report also shows the following pieces of information:
-
Number of customers who responded fully to survey
-
No of customers who responded partially
-
No of customers who did not respond to the survey
These stats are shown as plain HTML and shown based on the number of records (per page) shown in the report. These stats mainly only work with Voice surveys. For SMS surveys, it will show 0 for the No of customers who responded partially to survey.
Click the Export button to export the report on your local directory.
Once you click the Export button, a notification will appear that the request is in process and you have to go to Exported Reports menu item under the Reports menu.
Go to Reports → Exported Reports to see the list of reports exported.
https://machine-ip:3003/pcs open the link in the browser and add an exception to save the exported report
On this listing page, click on the link under File Path column to download the report on your machine. Each newly exported report is added in the bottom of the table.
You can also delete a particular entry to clear it from the list.
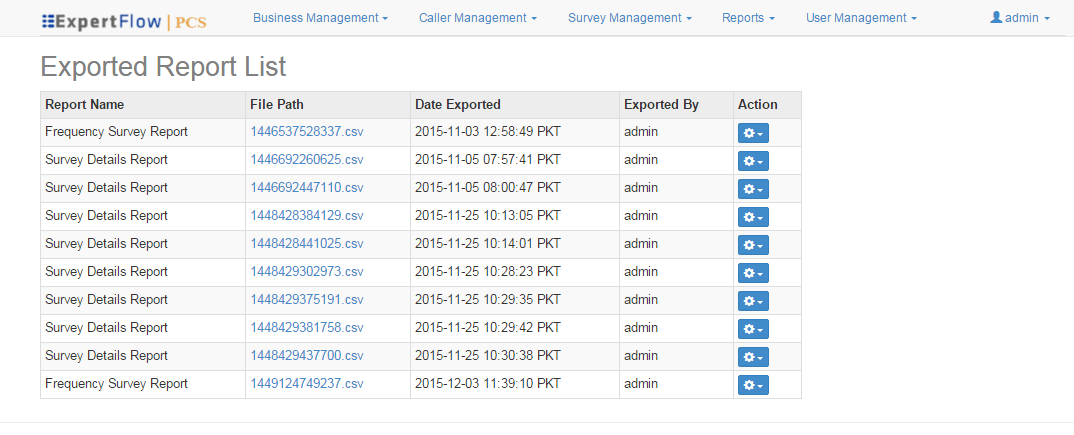
-
The stats of customers participating partially/ fully and customers who have not participated are only available via online report and are not available in the exported report.
-
Exported Report List shows only the reports which were requested to be exported by the currently logged-in user. Also, only the last 10 reports are shown in the list with the most recent record being at the bottom of the list.
-
All PCS reports show the survey ID instead of the survey name if the survey was removed from the system.
Summary Report
The summary report allows viewing survey statistics such as the number of times the survey was played to callers, the number of customers responding to a particular question, etc.
Access the report from Reports → Summary Report from the header. You can also access this report from within the Survey Report through Summary Report button.
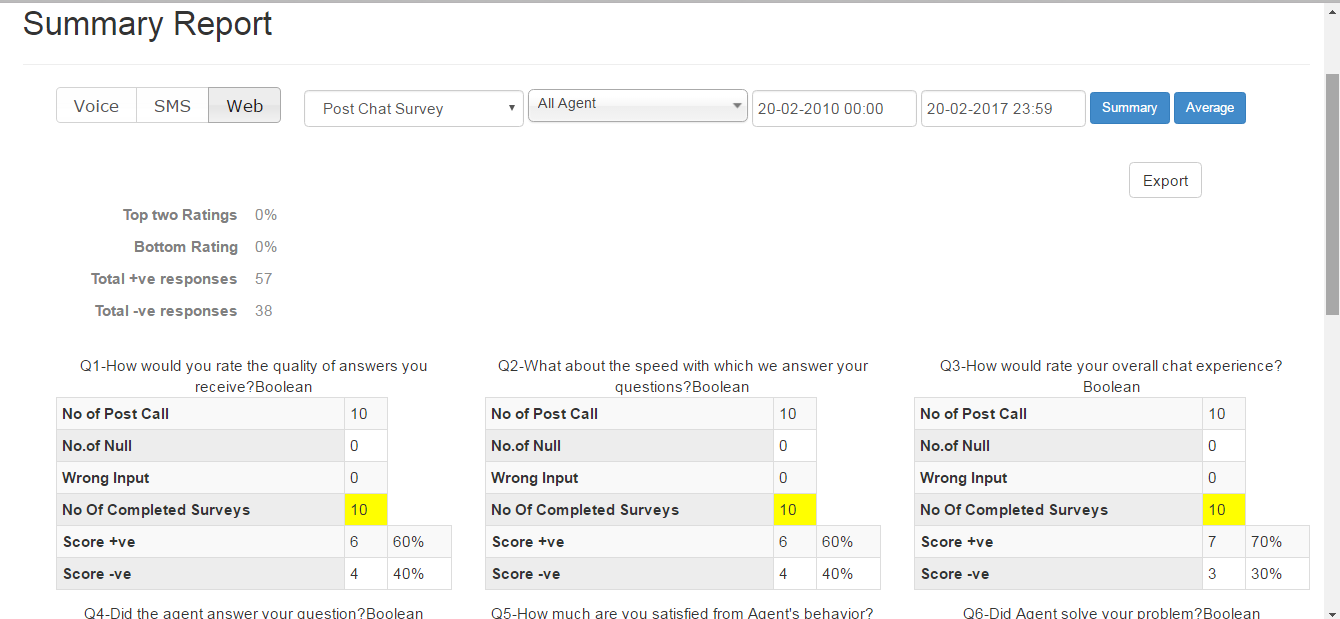
Select the survey channel from available channels, i.e. Voice, SMS, WEB.
Select survey name from Select Survey drop-down and select the date/time for the appropriate results. Click the Summary button to view the summary.
In the case of SMS surveys, the SMS text will appear on top of the table.
The information which is shown in this report is as specified below:
|
Name |
Description |
|
Top Two Ratings |
This will be the calculation of the top two scores, i.e. score 4 and score 5 (if the rating range is 1-5). This shows the overall percentage of score 4 and 5 got by the respondents to this survey. |
|
Bottom Rating |
This will be the calculation of the bottom two scores which is score 1(if the rating range is 1-5). This shows the overall percentage of score 1 got by the respondents to the survey. |
|
Total +ve responses |
This is the total number of positive answers. This shows only when the questions in the survey are of type Boolean. |
|
Total -ve responses |
This is the total number of negative answers. This shows only when the questions in the survey are of type Boolean. |
|
Question specific Statistics |
The following stats are shown against each question in the survey. |
|
No of Post Call |
This is the number of customers to whom the survey was played. |
|
No of Null |
The number of customers who hang up before answering this question Or the ones who did not provide an answer to this question and moved on to the next question. |
|
Wrong Input |
This is the number of customers who entered a number outside of the given range such as character input. Any number which is outside of the given rating range will be considered as wrong input in the PCS script and so in survey reports |
|
No of Completed Surveys |
The number of customers who answered this question in the survey. |
|
Scores |
These are the scores given by the customer to a particular question. It shows the number of times/percentage when a particular score was given to this question. In the case of boolean surveys, only the count for +ve and -ve scores are provided. In the case of rating surveys, the report shows the count for each score through 1-5 or 0-9 (based on the rating scale configured in the backend). |
The summary report is not generated for the MCQ-based questions for both Voice and Web surveys
Average Report
Click the Average button in the Summary Report to get the average of the scores given to a survey.
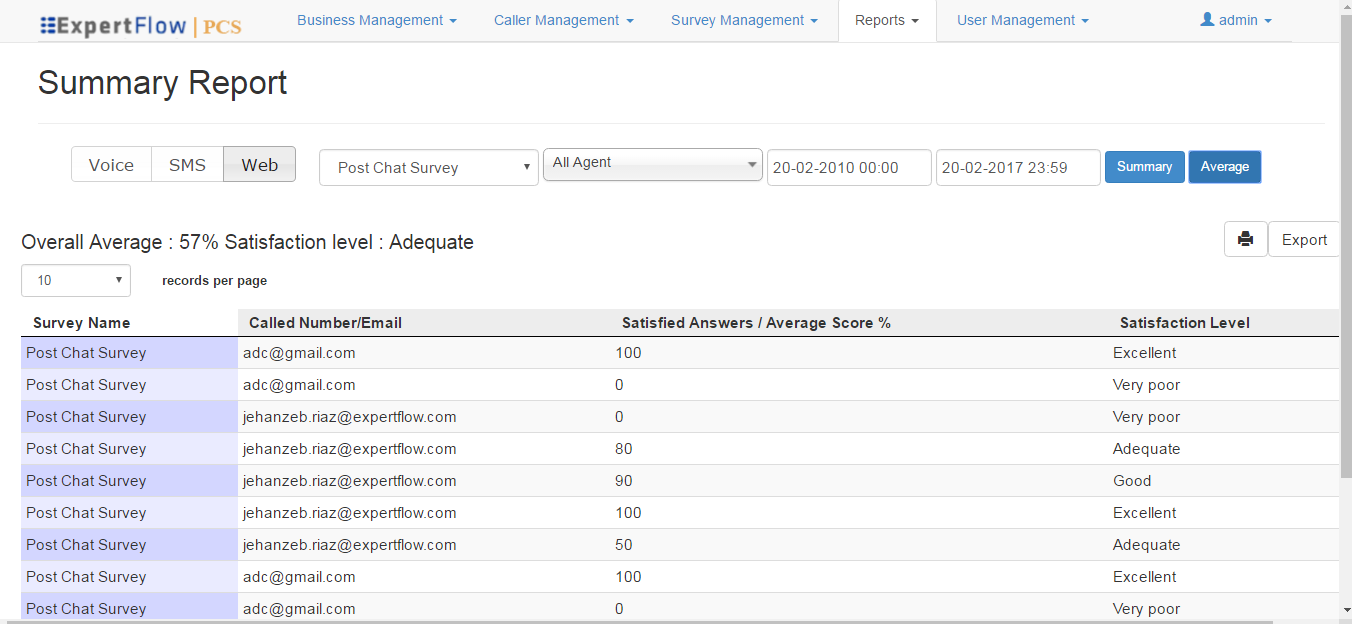
The method to calculate the average for “rating” and “boolean” type surveys is specified as below:
Survey Average for rating type surveys
Question weights disabled
When weights are disabled, the given score is considered as the actual score. So, all the sores are added together and divided by (number of questions * 10) to get the percentage.
For example, assume there are 3 questions in a survey and a score of 6 is provided to each question. The percentage (for the range 0 – 9) will be.
(((6+6+6)/(3*10))*100) = 60%
For the range of 1 – 5, suppose the given rating is 4, 4 and 4 to all three questions. Then the average percentage would be calculated as the following:
(((4+4+4)/(3*10))*200) =
The default weight is 10 for each score value for the range of 0 to 9 and 20 for the range of 1 to 5.
Calculating Average for boolean type surveys
In the case of boolean type surveys, the average report shows the number of satisfied answers instead of the average. This is calculated differently when question weights are enabled and/or disabled.
Questions weight disabled
The application places 10 for questions who have been answered with a ‘Yes’. To get the average, calculate the sum of all answers, divide it by the number of questions (multiplied by 10). The answer is then multiplied with 100 to get the percentage. For questions having ‘No’ as the answer, the application stores 0 as the score.
Just like Survey Detail report, you can export the Summary/Average report in the same manner.
Note that the “Summary Report” will only show the configured number of questions in the reports.
-
Summary and Average reports are not applicable to MCQ type survey questions
-
While calculating the average, the NPS question in the survey is not included in the calculation since it has a different rating scale than the standard questions rating scale.
Customer Report
The customer report in PCS allows seeing survey details with respect to the customer to whom the survey was played.
Access the report from Reports → Customer Report menu.
You can filter the report records based on customer ID/Name/Number of the customer (if available and pushed to PCS) and select the date/time range.
Click on the Submit button to see the report.
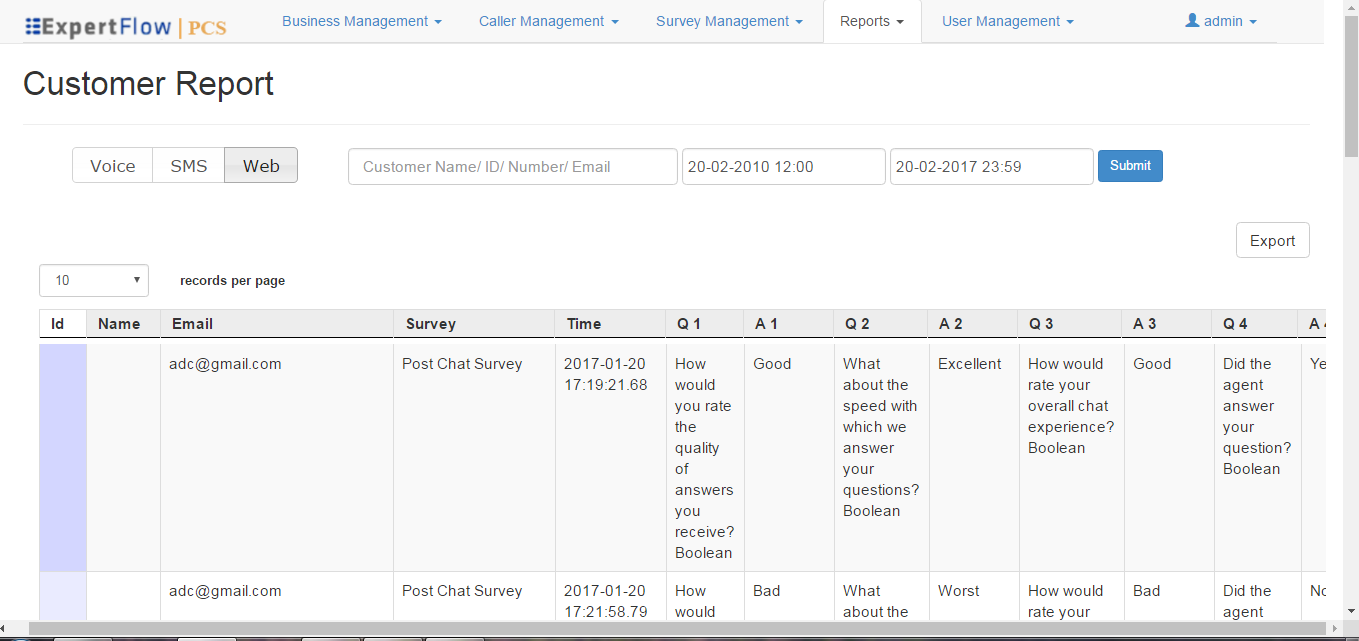
Select Voice, SMS or WEB buttons to see reports of voice, SMS or web-based surveys, respectively. Enter the date range to filter data based on the specified time range and click Submit.
This report gives survey details such as the Survey name that was played to the caller, the Name of the customer(optional), the Number/ANI/id of the customer (optional), the Email id of the customer (in case of web surveys as pushed by the chat application), the answers provided by the customer and the date/time when the feedback was recorded.
Click the Export button to export the report.
-
In the case of SMS surveys, it shows the SMS question id instead of SMS text in the exported/downloaded report.
-
For SMS surveys, Q1 and A1 columns of the report show SMS text and feedback message from the customer.
-
The report shows the id of a survey for a deleted survey.
-
The customer name is only shown if it is pushed to PCS via IVR.
Survey Audit Report
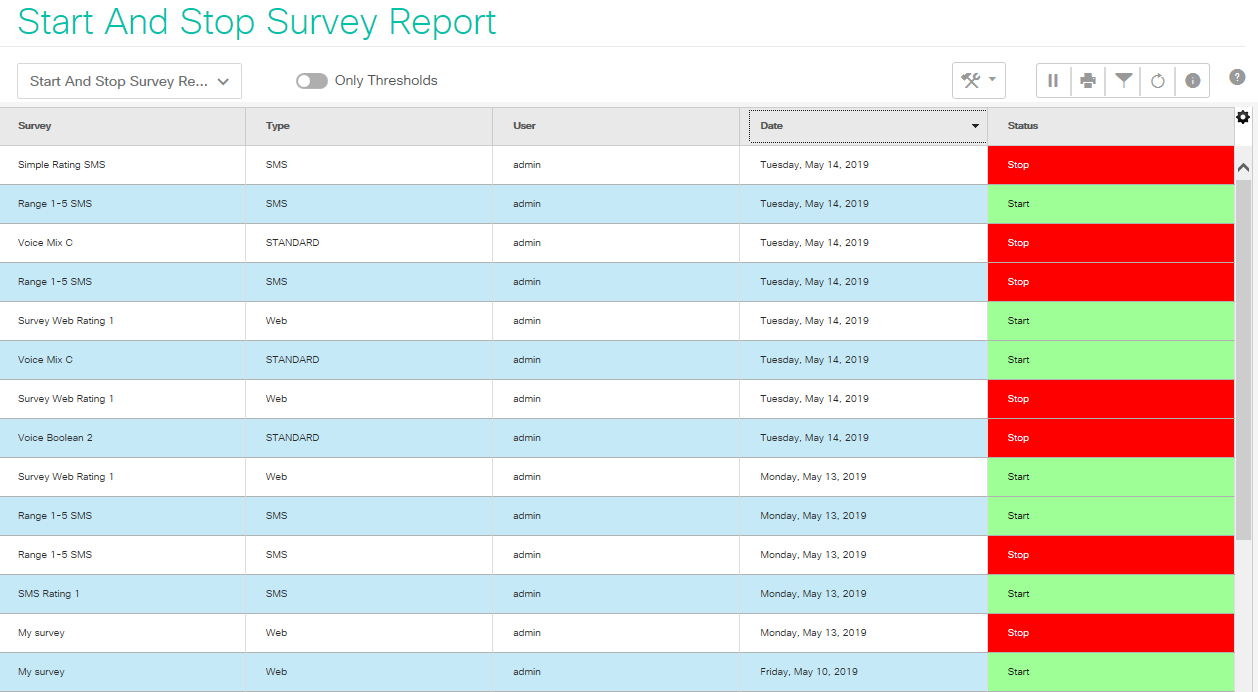
This report provides the audit when a particular survey was turned ON or OFF, the username of the user who performed this operation and the date/time when the operation was performed.
Go to Reports → Survey Audit Report from the menu.
Select the survey from Select Survey drop-down to see the audit report for that particular survey and click the Submit button to submit the report request.
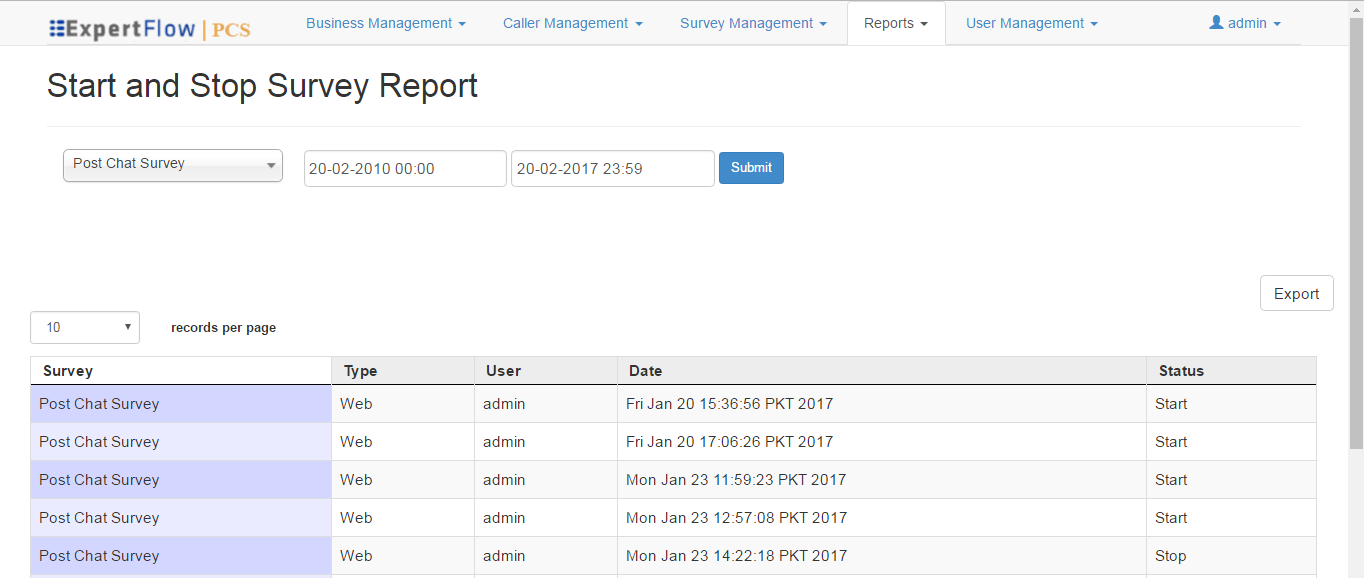
As can be seen in the image above, the report shows:
-
Survey: The name of the survey. For the surveys which are deleted, the report will show survey id instead of its name.
-
Type: The type of survey. It is SMS for SMS surveys, Real Time/STANDARD in case of voice surveys and WEB in case of web surveys. If a survey has been deleted, the type of that survey will appear as Deleted. In the case of CCX deployments, this field always shows the STANDARD type for voice surveys.
-
User: The username of the user who started or stopped the selected survey. It displays System if the survey was started/stopped via survey schedule.
-
Date: The date/time stamp when the survey status was updated.
-
Status: The status of the survey, i.e. either Start or Stop.
Click the Export button to export the report.
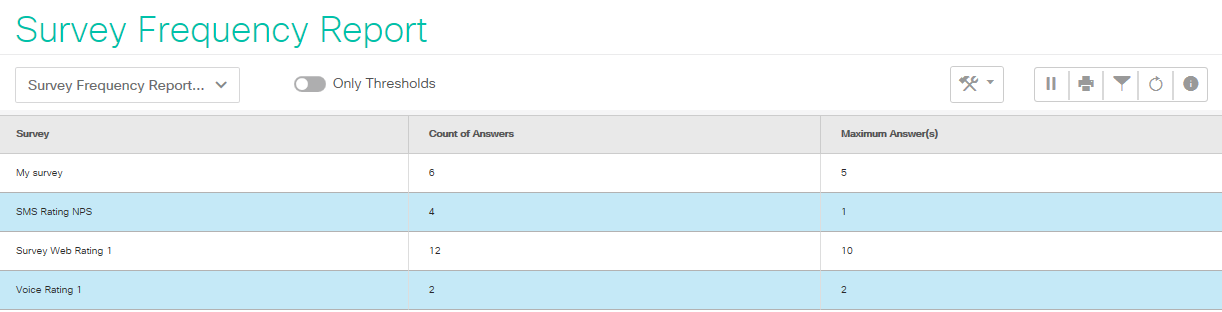
Survey Frequency Report
This report allows seeing the number of customers who provided answers to the survey questions and “maximum number of questions answered” in a survey.
Go to Reports → Survey Frequency Report menu.
On the Survey Frequency Report page, select the date/time range to see results only within that range and click the Submit button.
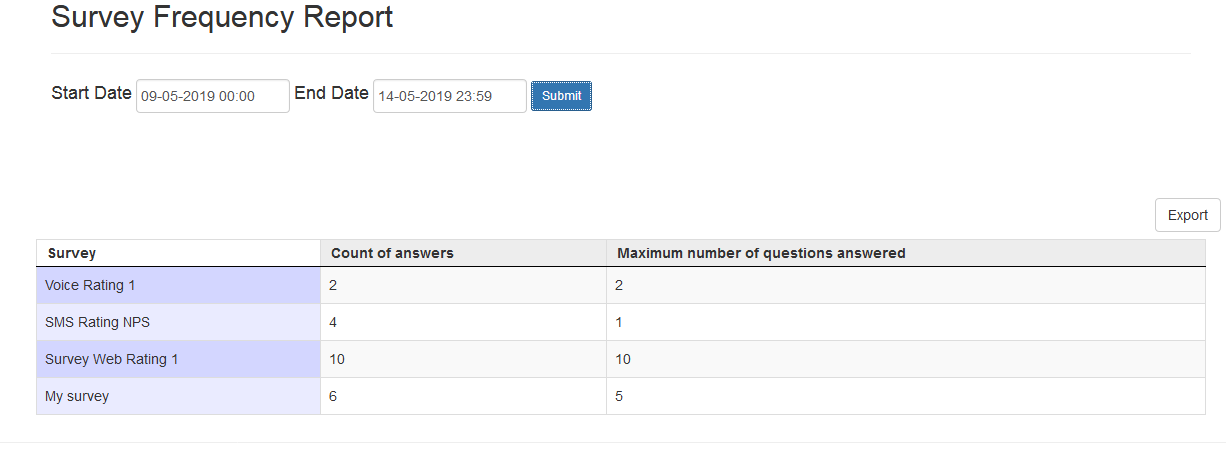
The Count of answers determines the number of times a particular survey is answered by customers where the Maximum Number of Questions Answered shows the maximum number of survey questions that got answered.
Just like the rest of the other reports, you can also export this report on the local machine by clicking the Export button.
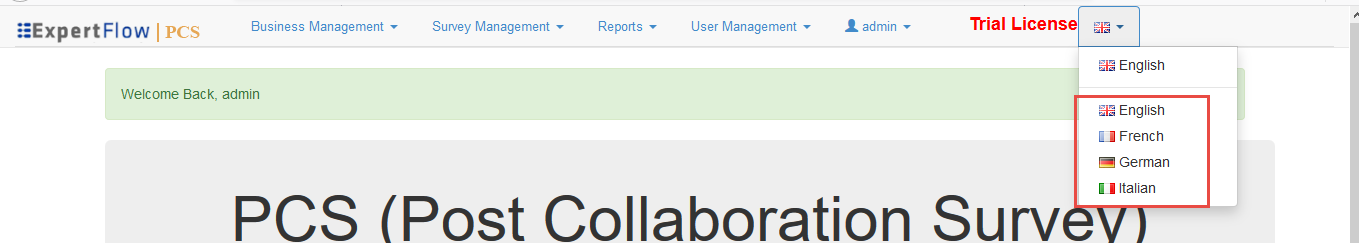
Translations
A language dropdown is added on the admin portal for the user to switch his UI language. English is the default language. The user can switch to any of the following languages,
-
French
-
German
-
Italian
for example as a French-speaking user, the translated UI elements across all application pages in French. This includes all menus and menu items, button captions, success and failure messages, data table column headings and dropdown options.
-
Any data elements such as survey names won't be translated. Only the UI elements are translated.
-
Exported reports won't be translated.
-
"Records per page", "Search labels" and any other Javascript labels won't be translated.
-
Gateway list pages are not translated.
CUIC Reports
These CUIC reports are for UCCX deployment.
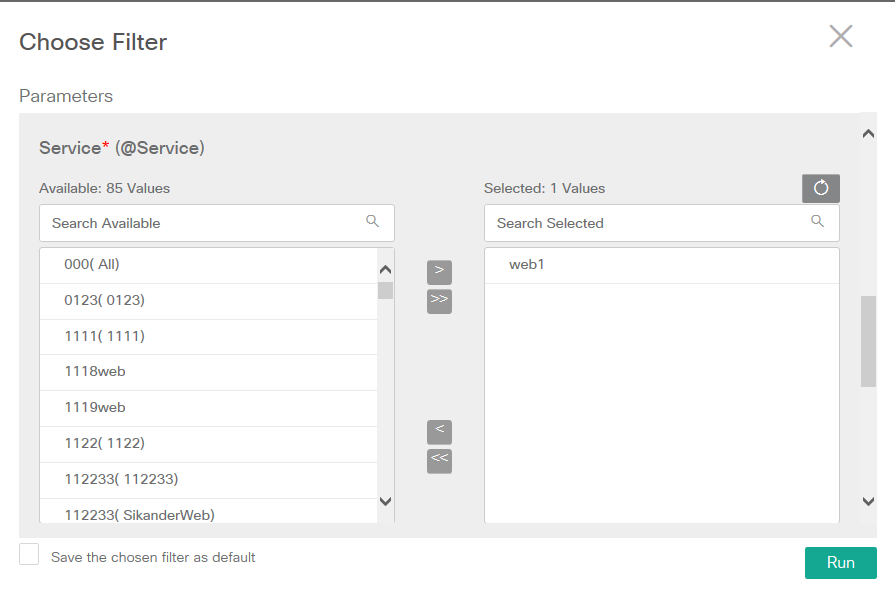
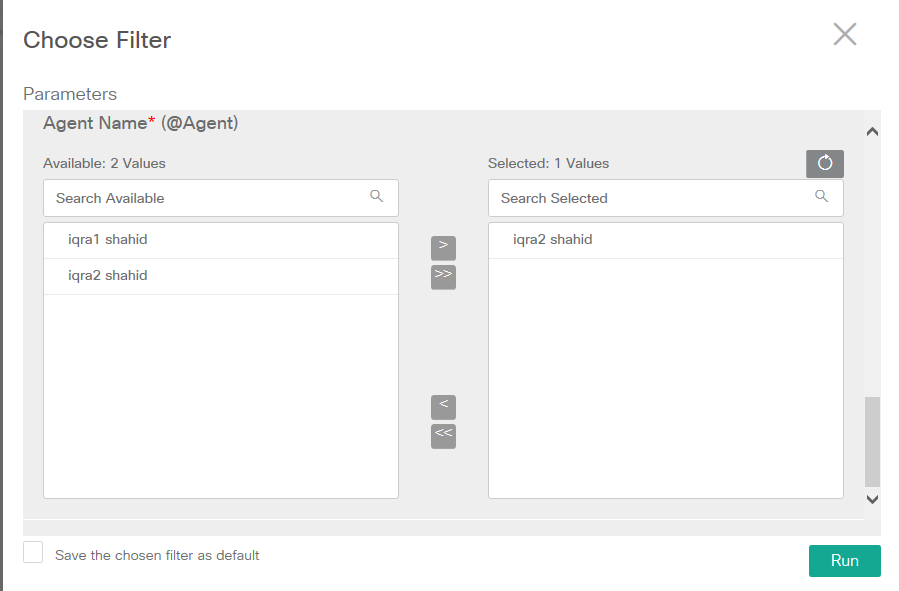
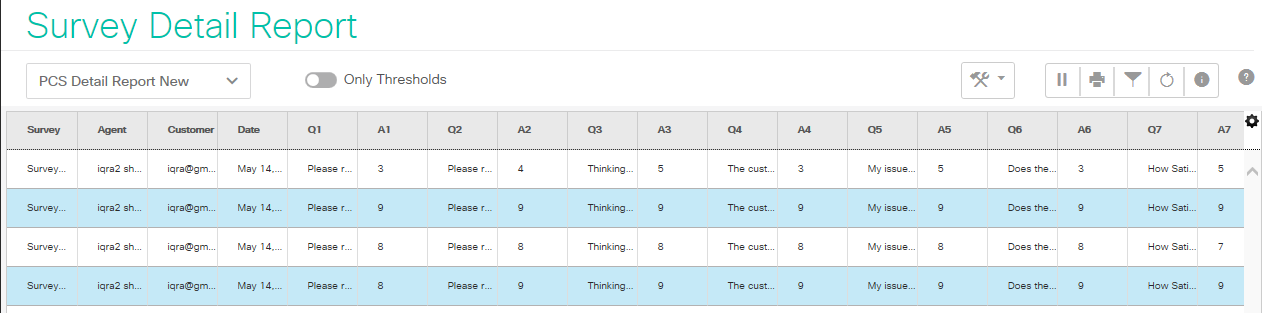
Survey Detail Report
This report gives details about a survey, such as the Survey Name, Agent Name, Customer, Date when the survey was played, the questions and the answers to the questions provided by the customer.
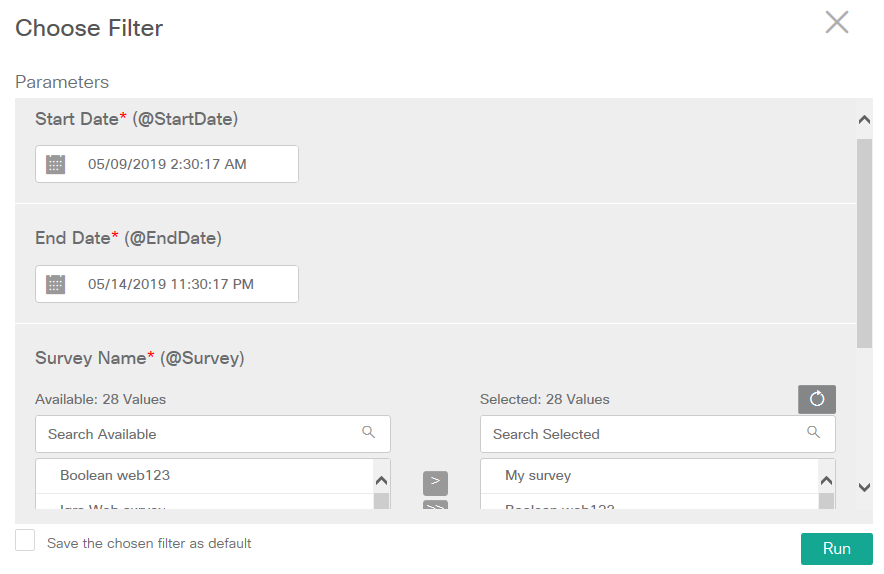
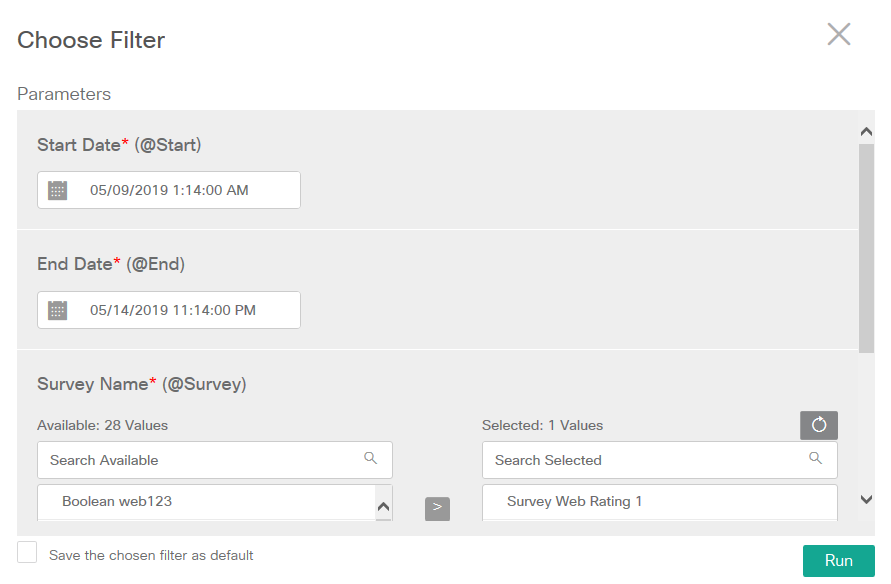
Select the filter Start Date, End Date, Survey Name, Service and Agent.
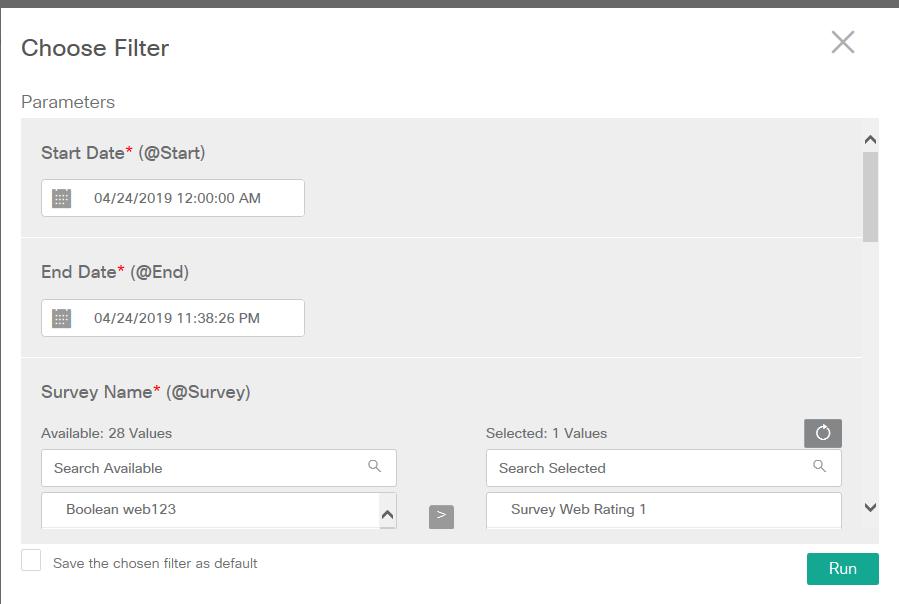
In the detail report, the following information would be shown to the customer.
|
Name |
Description |
|
Name |
Enter the name of the survey. |
|
Agent |
The name of the agent who answered the call as pushed by the IVR OR the third-party chat solution in case of web survey. |
|
Customer |
This shows the customer’s email ID in case of web surveys. In the case of voice/SMS surveys, it shows the customer’s phone number. |
|
Date |
This is the date and time when the feedback is submitted. |
|
Q1-Q9, NPS Question |
The columns show the questions configured in the selected survey. |
|
A1-A9, Answer |
The columns show the answers provided by the customer to the given questions. |
|
Total Answered Questions |
This column shows the total number of questions that were answered by the customer. |
|
Comments |
The column-fill in case of the Web survey |
CUIC Survey Audit Report
Same as PCS Audit Report.
Choose the survey filters and click Run to run the report.
The report shows:
-
Survey: The name of the survey. For the surveys which are deleted, the report shows survey ids instead of its names.
-
Type: The type of survey. It is SMS for SMS surveys, Real Time/STANDARD in case of voice surveys and WEB in case of web surveys. If a survey has been deleted, the type of that survey will appear as Deleted. In the case of CCX deployments, this field will always show the STANDARD type for voice surveys.
-
User: The username of the user who started or stopped the selected survey. It will display System if the survey was started/stopped via survey schedule.
-
Date: The date/time stamp when the survey status was updated.
-
Status: The status of the survey, i.e. either Start or Stop.
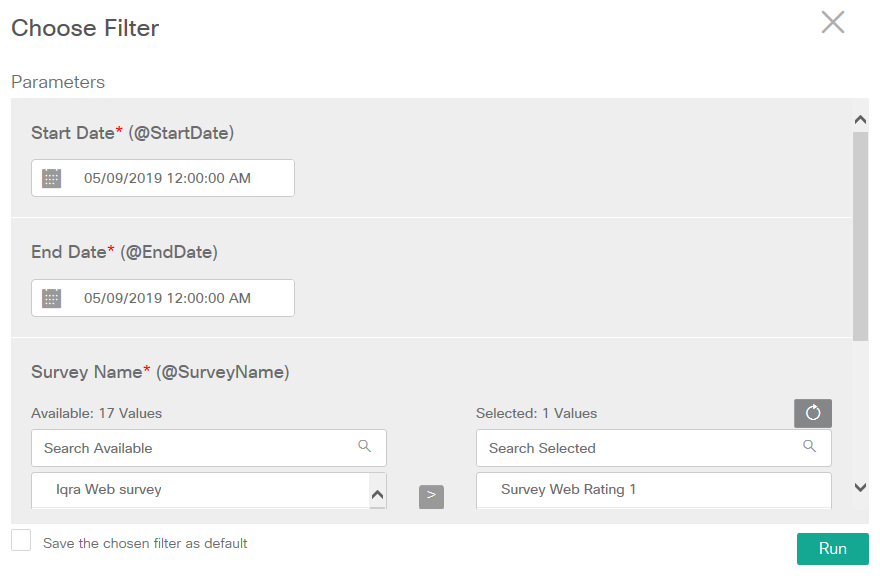
CUIC Survey Frequency Report
Same as PCS Frequency Report.
On the Survey Frequency Report page, select the date/time filters and click the Run button.
The Count of answers determines the number of times a particular survey is answered by customers where Maximum Answer(s) shows the maximum number of survey questions that got answered.
CUIC Summary Report Per Question
CUIC Summary Report Per Question - Rating
This is the graphical representation of the summary report for Rating type Surveys showing survey questions on the Y-Axis and number of score occurrences on the X-Axis.
Each Score is represented with a different colored bar.
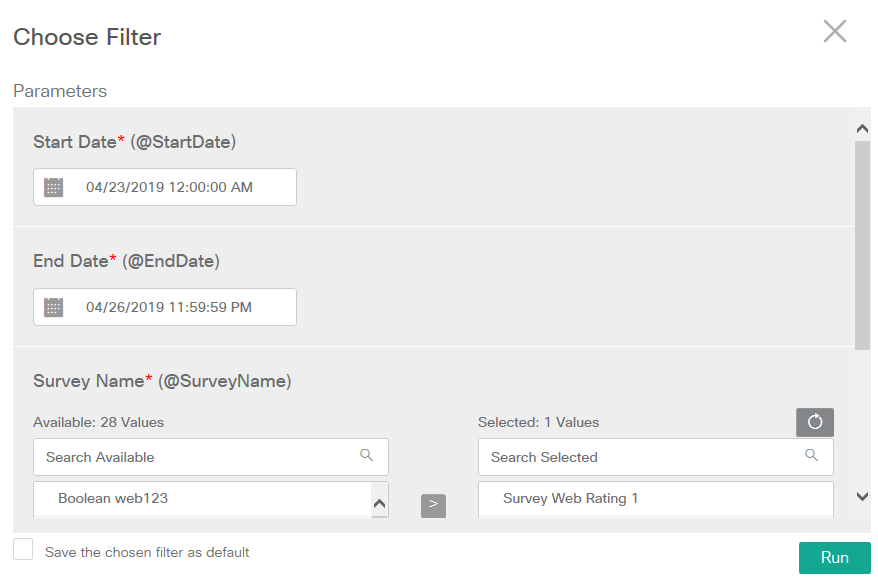
Choose the filter Start Date, End Date, and Survey Name.
Select a maximum of one survey from the filter.
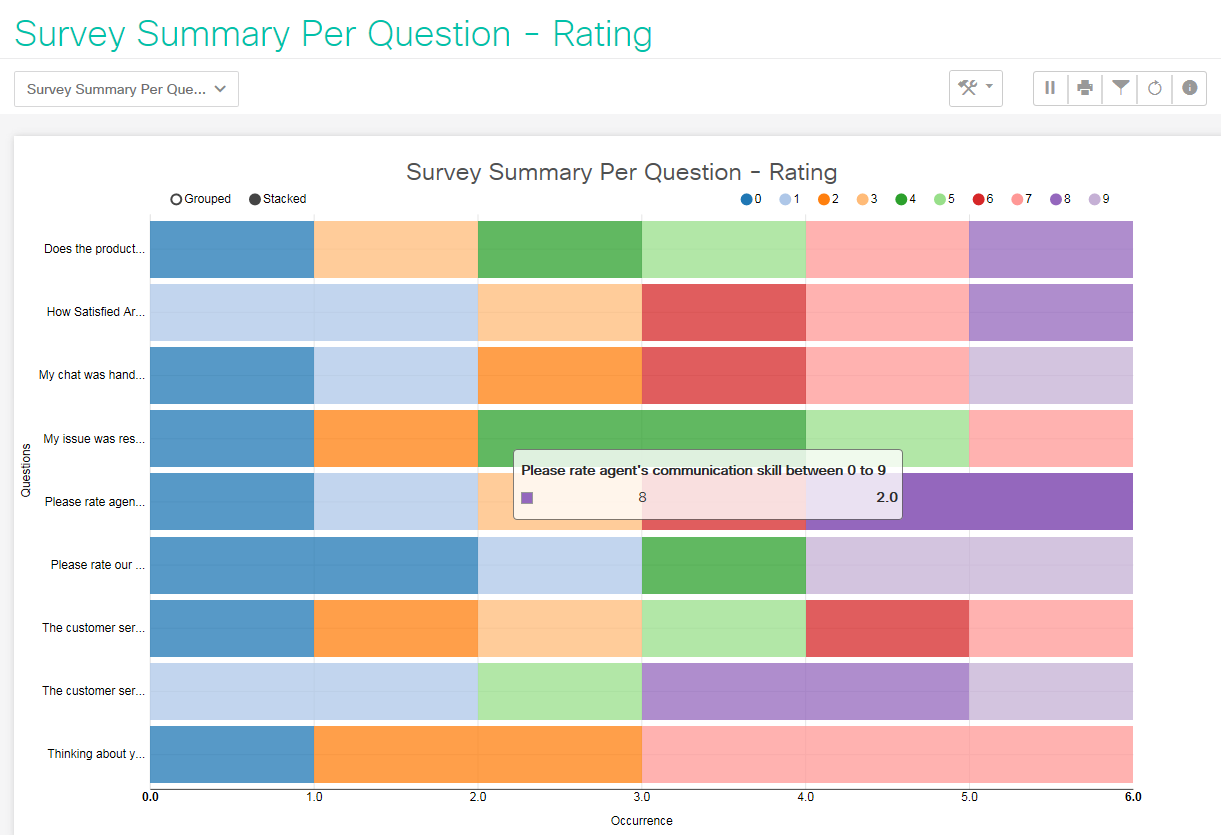
Choose Grouped or Stacked options to view data distribution in different bar chart layouts.
Hover the mouse on each bar to have more detailed insights. For instance, the screenshot above shows that the number of times (the number of occurrences of the score) the question was answered as ‘8’ was for 2 times.
CUIC Summary Report Per Question - Boolean
This is the graphical representation of the summary report for Boolean Surveys showing survey questions on the Y-Axis and number of score occurrences on the X-Axis.
Each Score is represented with a different colored bar.
Choose filter Start Date, End Date, and Survey Name. Select one survey at a time from the filter.
CUIC NPS Response Volume Report
This report is a graphical report which shows the data distribution of Promoters, Detractors, and Passives on a bar chart. Each category of response (Promoters: 9-10, Passives: 7-8, Detractors: 0-6) is represented with a different colored bar.
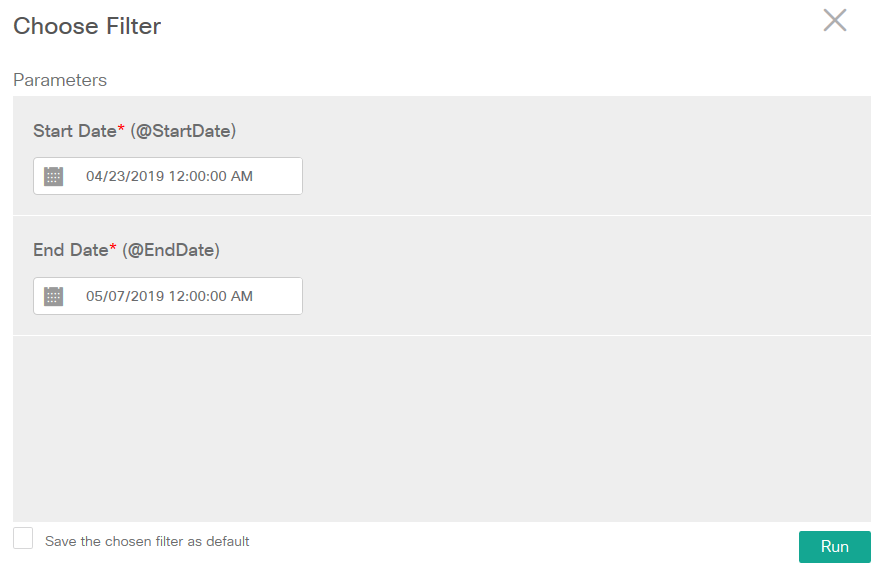
Select Start Date, End Date, and Survey Name. Select a maximum of one survey at a time from the filters.
Click the Run button.
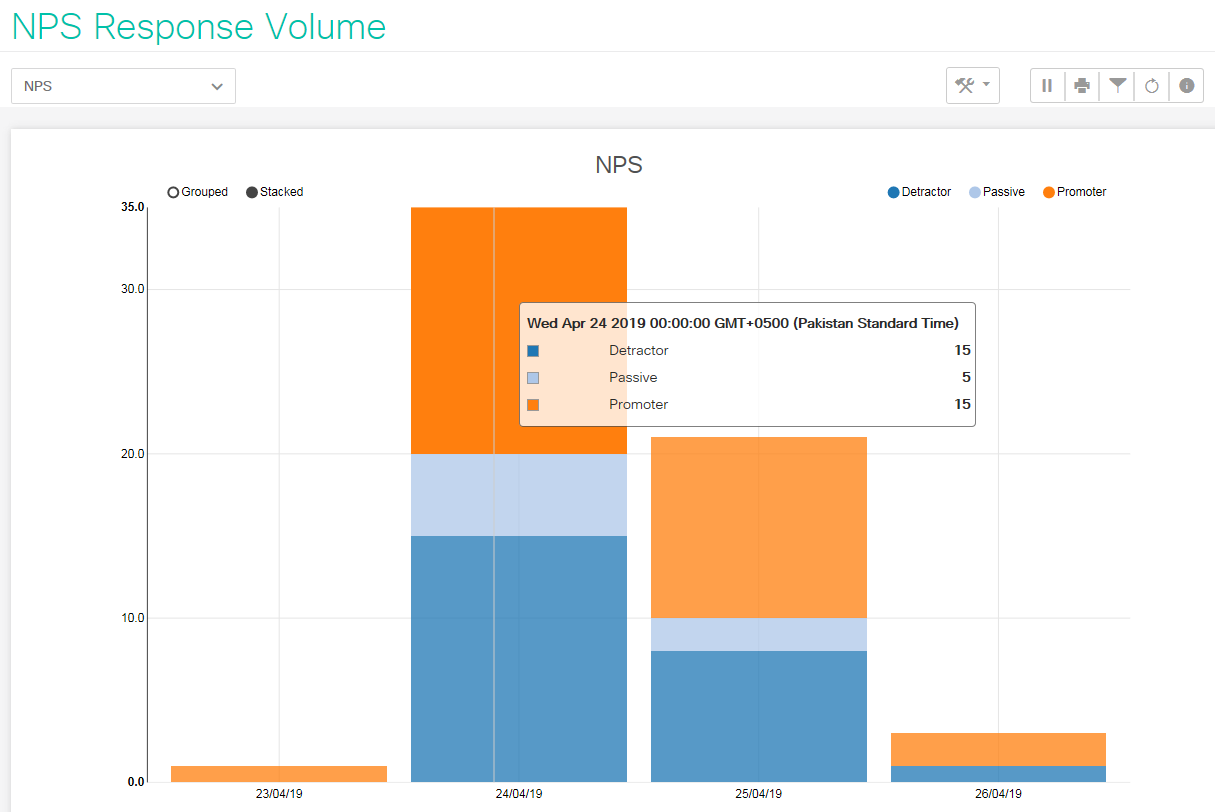
Hover the mouse on each bar to have more detailed insights.
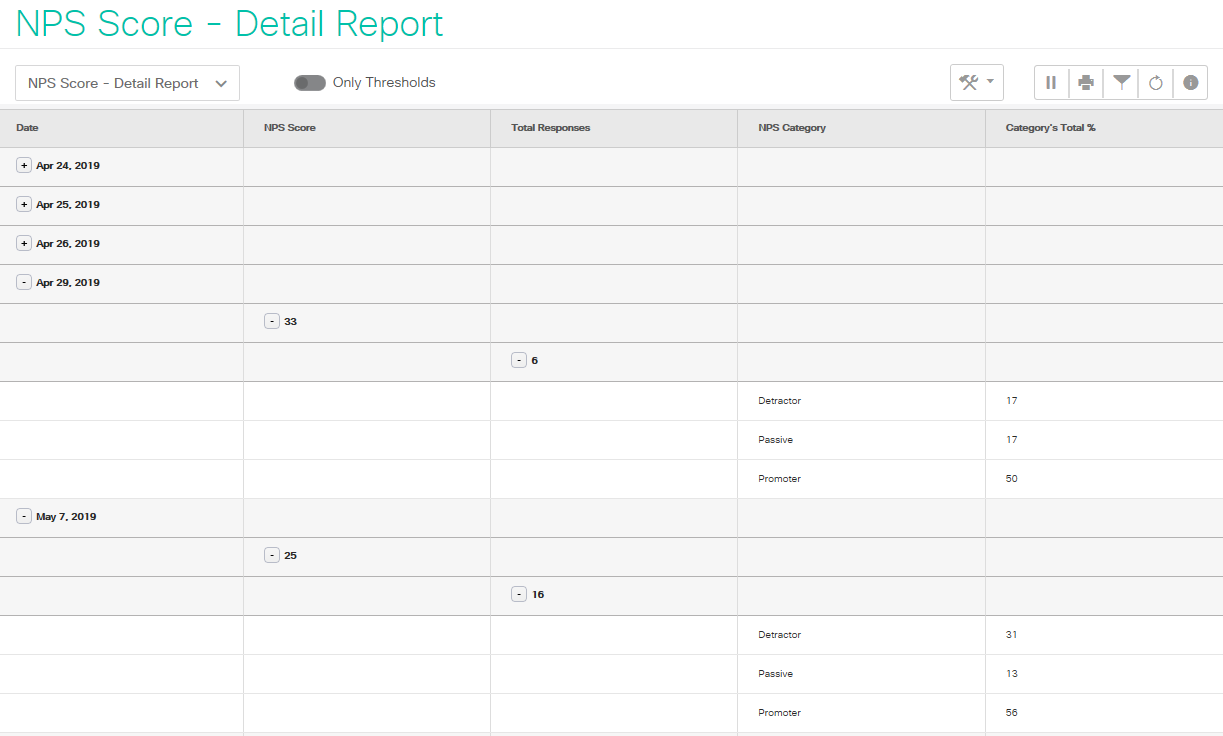
CUIC NPS Score Report
Select Start Date and End Date Click on Run
The plus icon shows a drill-down for further details. The drill-downs work as following:
-
Click on the date to drill down to see the NPS score
-
This opens up the NPS score. Click on the score to see further details for the response distribution
-
Drilling down on the NPS score shows the total responses received on the day in Total Responses column. Click on it to drill down to see the percentage of promoters, passives, and detractors.
The UI of the CUIC reports are all controlled by CUIC and cannot be customized by EF.
Survey Dashboard
For the front end understanding of dashboards, view User Guide
The following table describes the display types supported with the relevant data service attributes for the PCS data.
|
Visual Representation |
Allowed Attributes |
Description |
|---|---|---|
|
Pie Chart |
|
Breakdown of Promoters, Passives, and Detractors. NPS question in the survey, "On a scale of 0 to 10, how likely are you to recommend us to a friend?"
The pie chart shows the NPS breakdown in real-time. See PCS Data Service Specs for Survey Dashboard to learn more about the attribute definition. |
|
Doughnut Chart |
|
Breakdown of Promoters, Passives, and Detractors. NPS question in the survey, "On a scale of 0 to 10, how likely are you to recommend us to a friend?"
The doughnut chart shows the NPS breakdown in real-time. See PCS Data Service Specs for Survey Dashboard to learn more about the attribute definition. |
|
Speedometer |
|
The speedometer display shows the values of the listed attributes in real-time. See PCS Data Service Specs for Survey Dashboard to learn more about the attribute definition. |
|
Data Table |
|
The data table shows a real-time display of a survey with the listed attributes. See PCS Data Service Specs for Survey Dashboardto learn more about the attribute definition. |
|
Scorecards |
|
The data of the listed attributes are shown in the form of a scorecard in real-time. See PCS Data Service Specs for Survey Dashboardto learn more about the attribute definition. |
|
Line Chart |
|
The historical data for the listed attributes can be viewed in the historical interval. See PCS Data Service Specs for Survey Dashboard to learn more about the attribute's definition.
If data comparison is set to true, the comparison can be done for the NPS on a day this week and the previous week (on the same day) or hour wise (on an hour today and the same hour on the previous day) |
|
Bar Chart |
|
The historical data for the listed attributes can be viewed in the historical interval. See PCS Data Service Specs for Survey Dashboard to learn more about the attributes' definition.
If data comparison is set to true, the comparison can be done for the selected attribute on a day this week and the previous week (on the same day) or hour wise (on an hour today and the same hour on the previous day) |
See a sample dashboard as below:

The formula for
-
Completion Rate = (The number of completely filled surveys) / (Number of completely filled surveys + Number of partially filled surveys)
-
Response Rate = (Number of people who completed the survey/ Total sample group of the survey )
-
Net Promoter Score = ( %Promoters - %Detractors )
The Survey Dashboard is available only for CCE deployments. An on-demand test cycle can be executed to make it available for CCX.