This document will guide you to install Prometheus and Grafana including Node Exporter and cAdvisor to monitor not only your Docker infrastructure but also the host's stats. You will also be able to view the statistics of Expertflow Hybird Chat components i.e. Customer Channel Manager, Chat Server, and ActiveMQ. For the deployment, you require a virtual machine of following specifications:
|
|
Minimum requirement |
|---|---|
|
CPU |
2 cores vCPU |
|
RAM |
4 GB |
|
Disk |
100 GB mounted on / |
|
NICs |
1 NIC |
OS Compatibility
We require the customer/partner to install the following software on the server.
|
Item |
Version |
|
Any Docker compatible Linux Distro |
Administrative privileges (root) are required to follow the deployment steps. |
Docker Engine Requirements
|
Item |
version |
|
18.0 (or above) |
|
|
d ocker-compose |
1.25.x (or above) |
Access of the Host where Hybrid Chat is already installed will be required to install node-exporter and cAdvisor. Also the tcp ports 9100 and 8080 should be allowed through firewall.
SMTP server username and password is required if you want to enable alert notifications via email.
Deployment Steps
Clone the Prometheus Repository using git.
$ git clone https://gitlab.expertflow.com/general/prometheus.git
when the project is cloned, navigate to its directory and edit the prometheus.yml file
$ cd prometheus/prometheus
$ vi prometheus.yml
Host Monitoring
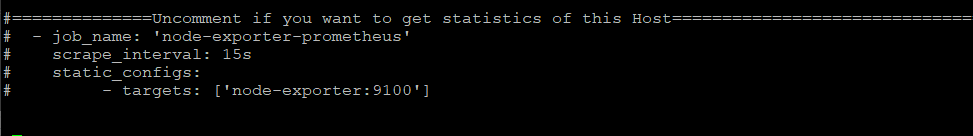
Uncomment the following lines if you want to display the stats of the host where Prometheus/ Grafana is installed.
Hybrid-Chat Monitoring
Stats of the Host where Hybrid-Chat is deployed are already enabled (uncommented) in Prometheus configuration. Although we shall be installing node-exporter there later. We just need to update the IP address of the host where HC is deployed.
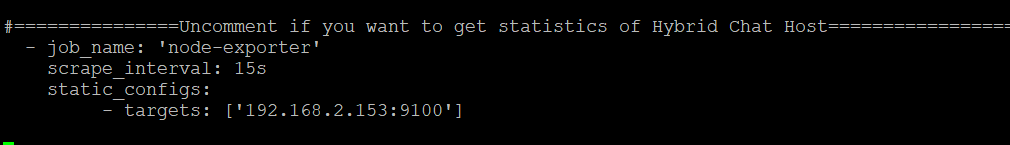
Replace the IP address ['192.168.2.153:9100'] in the targets: with the IP address of the HC host.
Enable Docker Stats of Hybrid-Chat
Stats of the Docker Containers of HC are already enabled (uncommented) in Prometheus. Although we shall be installing cAdvisor on HC host later. We just need to update the IP address of the host where HC is deployed.
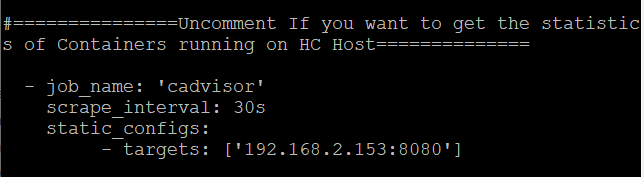
Replace the IP address ['192.168.2.153:8080'] in the targets: with the IP address of the HC host.
Hybrid-Chat Components
CCM
CCM container running on Hybrid Chat host already exposes metrics at : hcdev.expertflow.com/ccm/actuator/prometheus We just need to provide the IP address of HC host here.
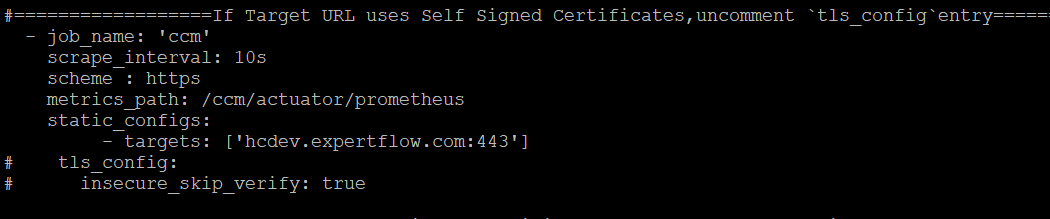
Replace the IP address ['hcdev.expertflow.com:443'] in the targets: with the IP address of the HC host.
If the Hybrid Chat FQDN uses Self Signed Certs, then uncomment the following:
tls_config:
insecure_skip_verify: true
Chat-Server
Chat Server container running on Hybrid Chat host already exposes metrics at : hcdev.expertflow.com/chat/metrics We just need to provide the IP address of HC host here.
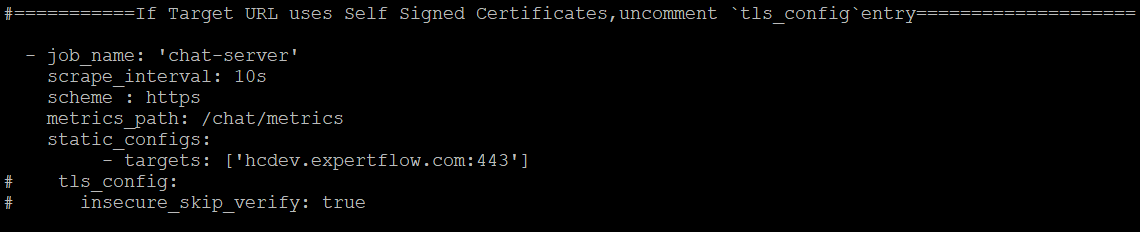
Replace the IP address ['https://hc-fqdn'] in the targets: with the IP address of the HC host.
If the Hybrid Chat FQDN uses Self Signed Certs, then uncomment the following:
tls_config:
insecure_skip_verify: true
ActiveMQ
ActiveMQ container running on Hybrid Chat host already exposes metrics at : 'https://hc-fqdn/activemq/metrics We just need to provide the IP address of HC host here.
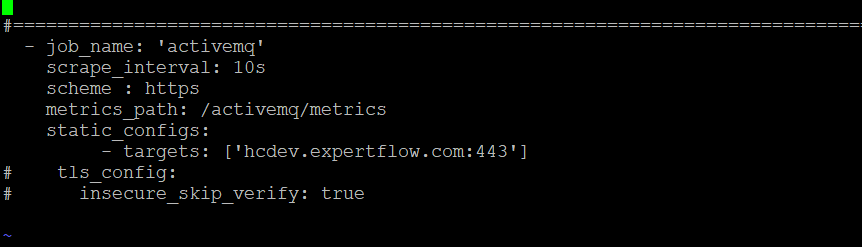
Replace the IP address ['hcdev.expertflow.com:443'] in the targets: with the IP address of the HC host.
If the Hybrid Chat FQDN uses Self Signed Certs, then uncomment the following:
tls_config:
insecure_skip_verify: true
Database Connector
Database Connector container running on Hybrid Chat host already exposes metrics at : 'https://hc-fqdn/database-connector/metrics We just need to provide the IP address of HC host here.
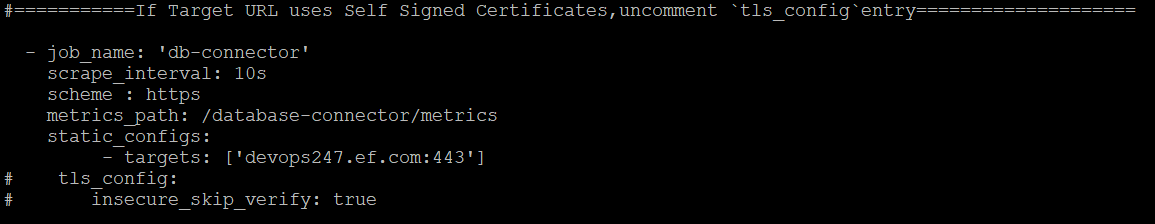
Replace the IP address ['devops247.ef.com:443'] in the targets: with the IP address of the HC host.
If the Hybrid Chat FQDN uses Self Signed Certs, then uncomment the following:
tls_config:
insecure_skip_verify: true
Bot Connector
Bot Connector container running on Hybrid Chat host already exposes metrics at : 'https://hc-fqdn/bot-connector/metrics We just need to provide the IP address of HC host here.
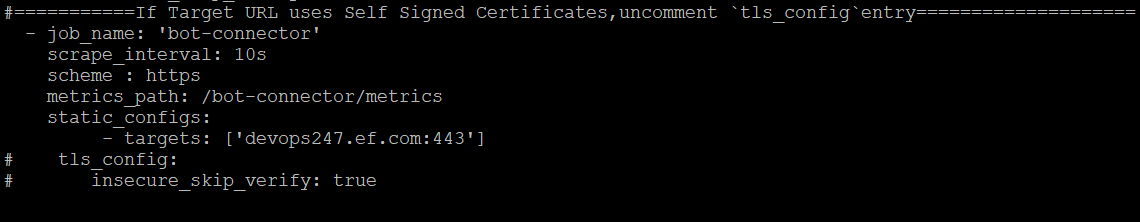
Replace the IP address ['devops247.ef.com:443'] in the targets: with the IP address of the HC host.
If the Hybrid Chat FQDN uses Self Signed Certs, then uncomment the following:
tls_config:
insecure_skip_verify: true
We are done editing the prometheus.yml. Press Esc key and write :wq to save and exit.
Configure Grafana to run behind Nginx
If you want to access the Grafana dashboard via Nginx reverse proxy, we need to configure it. In this example we will be accessing Grafana via Nginx running on Hybrid Chat host. Configurations at the Nginx are already done. To configure Grafana, navigate to Prometheus project that you have cloned earlier and move to Grafana directory inside it.
cd /location/to/prometheus/grafana
Now edit the defaults.ini file and look for the variable domain in server section. Change the value of domain to the FQDN of your Hybrid Chat Server FQDN.
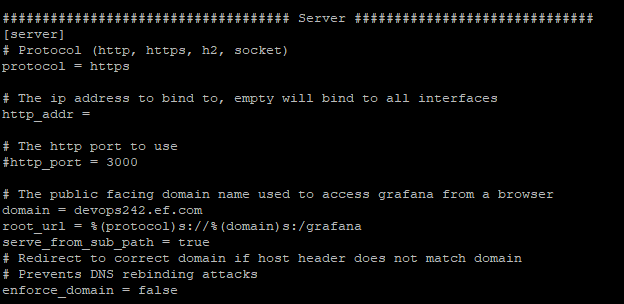
change the value of domain = devops239.ef.com to domain = your_hc_fqdn.com
After that, save and exit the file.
Enable Alerts and notifications
We can configure the alerts to trigger when:
-
There is High CPU load on Host in general
-
A specific container is consuming a lot of CPUs
-
There is High Memory load on Host
-
A specific Container is consuming a lot of Memory
-
Host storage is almost full
-
Container is down
We can change the configurations and to add or remove configurations of a specific condition when the alert should trigger, navigate to:
cd /prometheus/prometheus/
vi alert.rules
you can see the currently enabled configurations. For example, If we want to add an alert to trigger when a specific container is down, copy and paste the following code in the alert.rules file after altering it according to your needs.
#Trigger an alert if a container is down for more than 30 seconds:
  - alert: <container>_is_down
    expr: absent(container_memory_usage_bytes{name="<container_name>"})
    for: 30s
    labels:
      severity: critical
    annotations:
      summary: "<container_name> is down"
      description: "<container_name> is down for more than 30 seconds."
<container> can be a user friendly name and <container_name> should be actual name of container. Replace <container> and <container_name> with the actual name of the container. For instance, the above config can be translated as:
#Trigger an alert if a container is down for more than 30 seconds:
  - alert: MRE_Down
    expr: absent(container_memory_usage_bytes{name="expertflow_mre_1"})
    for: 30s
    labels:
      severity: critical
    annotations:
      summary: "MRE is down"
      description: "MRE container is down for more than 30 seconds."
Similarly if you want to trigger an alert when if a container is using more than 10% of total CPU cores for more than 30 seconds, copy paste the following code after changing it according to your needs.
  - alert: <container>_high_cpu
    expr: sum(rate(container_cpu_usage_seconds_total{name="<container_name>"}[1m])) / count(node_cpu_seconds_total{mode="system"}) * 100 > 10
    for: 30s
    labels:
      severity: warning
    annotations:
      summary: "<container> high CPU usage"
      description: "<container> CPU usage is {{ humanize $value}}%."
Similarly if you want to trigger an alert if a container is using more than 2GB of RAM for more than 30 seconds:
  - alert: <container>_high_memory
    expr: sum(container_memory_usage_bytes{name="<container_name>"}) > 2000000000
    for: 30s
    labels:
      severity: warning
    annotations:
      summary: "<container> high memory usage"
      description: "<container> memory consumption is at {{ humanize $value}}."
Similarly alerts for the followings are configured by default.
-
Trigger an alert if the Docker host storage is almost full.
-
Trigger an alert if the Docker host memory is almost full.
-
Alert for any instance that is unreachable for >2 minutes.
-
Trigger an alert if the Docker host CPU is under high load for more than 30 seconds
When you are done configuring the alerts in alert.rules, :wq and exit the file.
Prometheus is also shipped with the utility called alertmanager which can be used to trigger alerts when certain service / job is down and send notifications via Email, Pagerduty and Slack.
Alerts by Email:
For that purpose, navigate to prometheus directory and then alertmanager dirctory. Edit the config.yml file
cd /prometheus/alertmanager
vi config.yml
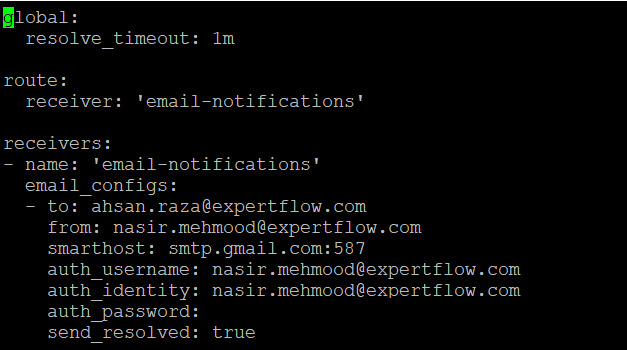
In config.yml, you need to update the smtp settings in the receivers: section.
to: means the email address you want to send notifications. (can be a group email address)
from: Sender email address
smarthost: Let it be that way if you are using Google email address.
auth_identity: The SMTP server email address
auth_password: can be your application password generated in your Google account settings.
Save this file by typing :wq.
Now you will receive email notifications from the email address you have configured when alert is triggered in Prometheus
Alerts by Google Chat
We can also configure the alertmanager to send alerts to our desired Google Chat Room. For this purpose, we use an open source utility called Calert. It's deployed with the Prometheus/Grafana solution we just need to configure it to send alerts to our Google Chat Room.
Configuration at the Google Chat Room:
-
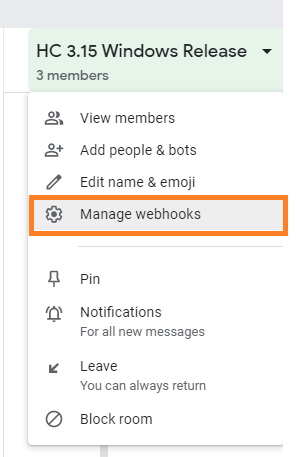
Got to the Google Chat Room you want to push alerts and Click on the title. It will open the following drop down menu. Click on the Manage Webhook.
-
-
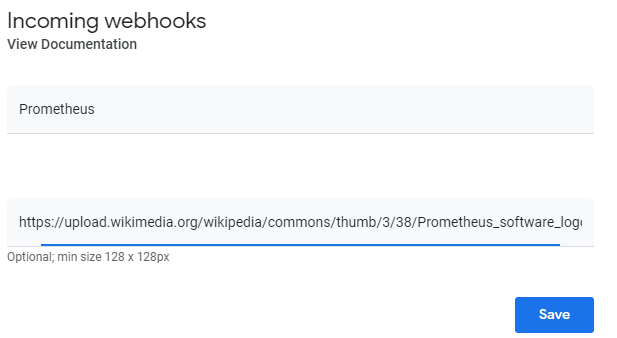
Enter the name of webhook and the URL for the image you want to use it as Avatar.
-
-
Click on Save and copy the webhook URL. We are going to use it in the configuration.
Configurations at the Deployment:
-
Navigate to the Prometheus dir and then to the alertmanager dir.
-
cd promethues/alertmanager
-
edit the
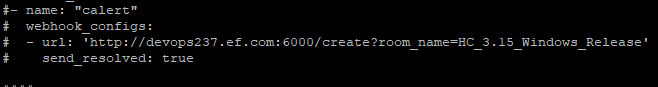
config.ymlfile and uncomment the following changes-
url: the URL of the node on which Prometheus is being deployed + port 6000 i.e. 'http://devops237.ef.com:6000/create?room_name=HC_3.15_Windows_Release'
-
replace the
room_name=<name_of_your_chat_room>. Chat Room named,HC 3.15 Windows Releaseturned intoHC_3.15_Windows_Release
-
-
-
Save the file and quit by :wq
-
Navigate to gchat dir by typing the following command:
cd ../gchat
-
Edit the config.toml file and navigate to the end of the file
-

-
Change the [
app.chat.HC_3.15_Windows_Release] to the[app.chat.your_room_name] -
Change the value of the above variable to the webhook you have copied in the configuration of Google Chat Room.
-
-
Save the file and quit by :wq
Allow Ports
Before installing the Prometheus/ Grafana, make sure the following ports are already allowed in the firewall. To allow the ports through firewall, run the following commands.
firewall-cmd --add-port=3000/tcp --permanent
firewall-cmd --add-port=9100/tcp --permanent
firewall-cmd --add-port=9090/tcp --permanent
firewall-cmd --add-port=9093/tcp --permanent
firewall-cmd --add-port=6000/tcp --permanent
firewall-cmd --reload
Bring up the solution
To bring up the solution, navigate to the root of the Prometheus directory and simply run docker-compose up -d.
Verify the Prometheus Setup.
If you run docker ps, you should see the following containers up and running.
CONTAINER ID   IMAGE                    COMMAND                  CREATED       STATUS          PORTS                    NAMES
d9672973bf34   grafana/grafana          "/run.sh"                6 hours ago   Up 12 minutes   0.0.0.0:3000->3000/tcp   prometheus_grafana_1
06253b3998c7   prom/prometheus:v2.1.0   "/bin/prometheus --c…"   6 hours ago   Up 12 minutes   0.0.0.0:9090->9090/tcp   prometheus_prometheus_1
b81d54ab3bf7   prom/node-exporter       "/bin/node_exporter …"   6 hours ago   Up 12 minutes   0.0.0.0:9100->9100/tcp   prometheus_node-exporter_1
32ed033e0fb0   prom/alertmanager        "/bin/alertmanager -…"   6 hours ago   Up 12 minutes   0.0.0.0:9093->9093/tcp   prometheus_alertmanager_1
Installation Steps on Hybrid Chat Host
We just need to run a docker-compose file on the HC host. This will start the cAdvisor and node-exporter on the HC host. But before running the Prometheus installation, make sure the following ports are allowed.
firewall-cmd --add-port=8080/tcp --permanent
firewall-cmd --add-port=9100/tcp --permanent
firewall-cmd --reload
$ vi docker-compose-prometheus.yml
and paste the following code inside the docker-compose-prometheus.yml
networks:
  chat-solution:
    external: true
services:
  cadvisor:
    image: google/cadvisor:latest
    volumes:
      - /:/rootfs:ro
      - /var/run:/var/run:rw
      - /sys:/sys:ro
      - /var/lib/docker/:/var/lib/docker:ro
    privileged: true
    command:
      - '-housekeeping_interval=10s'
      - '-docker_only=true'

    cpus: 4.0
    cpu_shares: 73
    mem_limit: 4G
    memswap_limit: 4G
    mem_reservation: 512mb
    ports:
      - 8081:8080
    networks:
      - chat-solution
    restart: always
  node-exporter:
    image: prom/node-exporter
    volumes:
      - /:/host:ro,rslave

    cpus: 4.0
    cpu_shares: 73
    mem_limit: 4G
    memswap_limit: 4G
    mem_reservation: 512mb
    command:
      - '--path.rootfs=/host'
      - --collector.filesystem.ignored-mount-points
      - "^/(sys|proc|dev|host|etc|rootfs/var/lib/docker/containers|rootfs/var/lib/docker/overlay2|rootfs/run/docker/netns|rootfs/var/lib/docker/aufs)($$|/)"

    ports:
      - 9100:9100
    networks:
      - chat-solution
    restart: always
after saving it, run the docker-compose file
$ docker-compose -f docker-compose-prometheus.yml up -d
In the case of HA, You need to run the above file on Primary and Secondary nodes if you want to extract the metrics of both machines.
Update the prometheus.conf
Navigate to the directory where solution is installed i.e. if installed in default directory /var/lib/expertflow/ and move to the docker/nginx/ . There is a file named: prometheus.conf We need to edit this file.
cd /var/lib/expertflow/docker/nginx
vi prometheus.conf
Look for the location /grafana/ in this file and update the proxy_pass value to the FQDN of machine where Grafana /Prometheus is set up. (Example is given below)
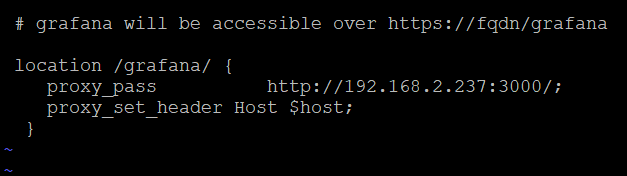
Assume that the http://192.168.2.237:3000/ is the IP address of the VM where Grafana /Prometheus is installed.
After changing the proxy_pass, save prometheus.conf and exit the file.
Update Nginx configurations
Navigate to the directory where solution is installed i.e. if installed in default directory /var/lib/expertflow/ and move to the docker/nginx/ .
If the solution is deployed in singleton mode, we need to edit https-singleton.conf. Now vi https-singleton.conf and look for the option of #include /etc/nginx/prometheus.conf and uncomment it.
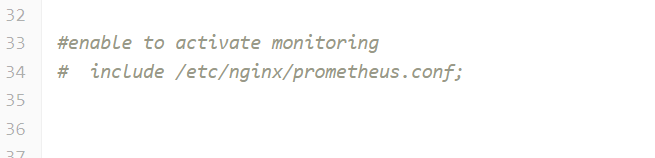
Similarly if the solution is deployed in HA, then we need to update the https.primary.conf on primary machine and https.secondary.conf on secondary machine. Look for the option of #enable to activate monitoring and uncomment it.
After making the changes, save and exit the file.
Now navigate to the directory where solution is installed i.e. if installed in default directory /var/lib/expertflow/ and move to the active/ .
Edit the docker-compose-service-gateway.yml file if the solution is deployed in singleton mode. Navigate to volume section and uncomment the following line.
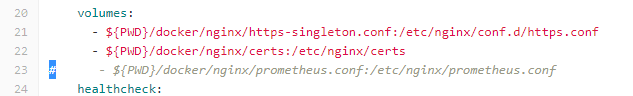
Similarly if the solution is deployed in HA, we need to uncomment the same line in the docker-compose-service-gateway.yml file on both Primary and Secondary machine.
After you are done making changes, save and exit the file.
Now we need to remove the service of App-Gateway and start it again sing efutils.
[root@centos-ahsan prometheus]# efutils service

 Please select Expertflow Service Container:
 1) expertflow_activemq_1            12) expertflow_ecm-services_1
 2) expertflow_agent-gadget_1        13) expertflow_file-engine_1
 3) expertflow_app-gateway_1         14) expertflow_minio_1
 4) expertflow_bot-connector_1       15) expertflow_mongo_1
 5) expertflow_ccm_1                 16) expertflow_mre_1
 6) expertflow_chat_1                17) expertflow_mre-frontend_1
 7) expertflow_comm-server_1         18) expertflow_mre-microservice_1
 8) expertflow_customer-gadget_1     19) expertflow_mysql_1
 9) expertflow_database-connector_1  20) expertflow_portainer_1
10) expertflow_ecm_1                 21) expertflow_umm_1
11) expertflow_ecm-frontend_1
Select 3) expertflow_app-gateway_1
Please select:3

 Please select action for expertflow_app-gateway_1
1) up
2) stop
3) kill
4) restart
5) rm

Please select: 5
Selecting 5) rm will remove the service of App Gateway. Now we need to start it again. Run efutils profile
[root@centos-ahsan prometheus]# efutils profile

 Please select Expertflow Service Profile
1) agent-gadget       6) db-connector     11) routing
2) amq                7) hc-server        12) service-gateway
3) campaigns          8) mongo            13) umm
4) ccm                9) mysql
5) customer-gadget   10) portainer
Select 12) service-gateway and Select 1) up option.
Please select:12

 Please select action for  service-gateway
1) up
2) down
3) restart
4) ps


Please select:1
performing  up -d   operation on  service-gateway
docker-compose -p expertflow --env-file /var/lib/expertflow/coreversion.env  -f /var/lib/expertflow/sds/docker-compose-service-gateway.yml  up -d
up -d on service-gateway performed successfully
That's it. We are done with the installation of Prometheus on Hybrid Chat Host. Now we need to add the dashboards in Grafana. Grafana UI can be accessed via your_hc_fqdn.com/grafana