ElasticSearch
ElasticSearch is a backendd Engine that ingrests the logs stream from different sources and saves them for visualizations. The Kibana component is used to visualize and maintain logs for proper display.
Grafana-Loki
Grafana-Loki requires a working Grafana Server for visualizing the logs streams.
Add Loki as Input
-
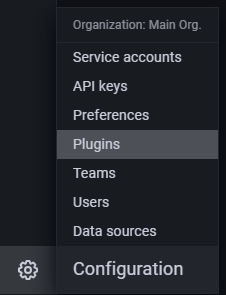
Click on the Gear Icon in bottom-right corner and select plugins
-
-
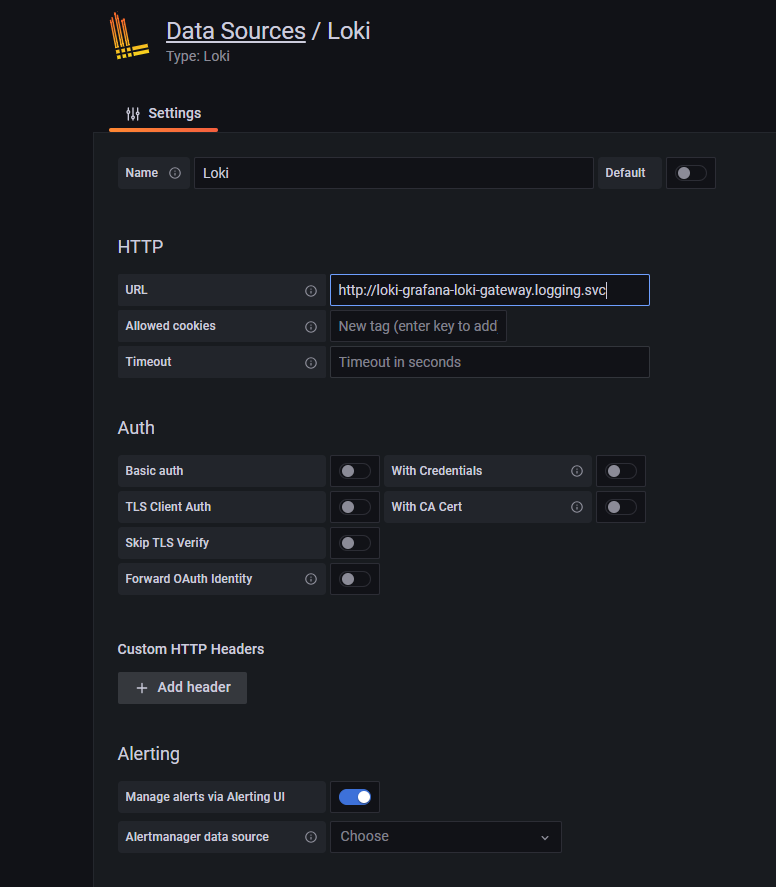
search for the "loki" in the plugins list.
-
and setup the configuration parameters.
-
-
Once done, click save and test.
For an easy to use dashboard for logs, please follow these steps.
-
Login to Grafana using Administrator account ( normally this is admin with password setup during bootstrapping )
-
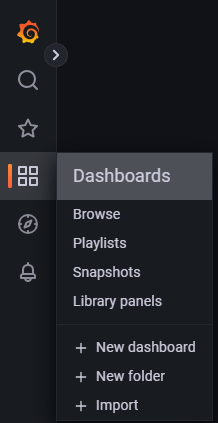
Click on the 4-square Icon in the left-panel and Select Dashboards
-
-
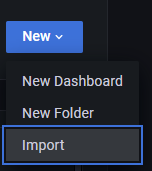
Click New
-
and then select Import
-
Input the Dashboard ID 13639 and select the Loki as Source. Tthis method requires a direct access to the internet from the Grafana instance. You can also download the JSON from grafana dashboards website and import using import as Json mechanism.
View the Logs.
-
Select the 4-squares Icon and then select Dashboards,
-
Select the Name of the Dashboard that was created in previous step.
-
This dashboard has a drop down menu at the top, which gives you the flexibility of viewing logs for a specific pod.
You can also create Your own Dashboard for different hierarchically viewing by clicking Add Dashboard and selecting loki as source.