Getting Started
When you log in to the AgentDesk, the rendered interface depends upon the role with which one has logged in.
So if you are an agent, you by default will have access to all features explained in the Agent Guide whereas supervisors get default access to everything that agents have, plus the additional features that are explained below. See also, Security and User Permissions to see the additional capabilities of a supervisor.
Monitor Dashboards
The dashboards embedded in AgentDesk are the real-time dashboards for supervisors to view the summary statistics of the contact center including queues, agent states, and real-time conversations that are ongoing with agents and the bots. With the new team-based implementation, supervisors can see the list of conversations based on the team(s) that they supervise.
-
The supervisor must have at least one team for instance, Team Alpha
-
The supervisor must have at least one agent within her team. For instance, Agent-1 is a member of Team Alpha, which is supervised by Supervisor John.
-
Next, access the unified admin application and assign agent attributes to Agent-1. This will establish a connection between Agent-1 and any available queue.
-
Then, log in as Agent-1 in the unified agent system at least once. This will ensure that all the changes made to Agent-1 take effect.
-
Now, the supervisor can log in as Supervisor John and observe that the Team Alpha & the queue(s) associated with Team Alpha are visible on the dashboard / Grafana. This allows the supervisor to view the corresponding data.
There are two types of dashboards currently available:
-
Summary Dashboards - built within Grafana to display summarized stats of queues, agents, active conversations, and MRDs
-
Detail Dashboards - built within AgentDesk for details about active/queued conversations, agent activities
Let's walk through the following to have more details on it.
Summary Dashboard
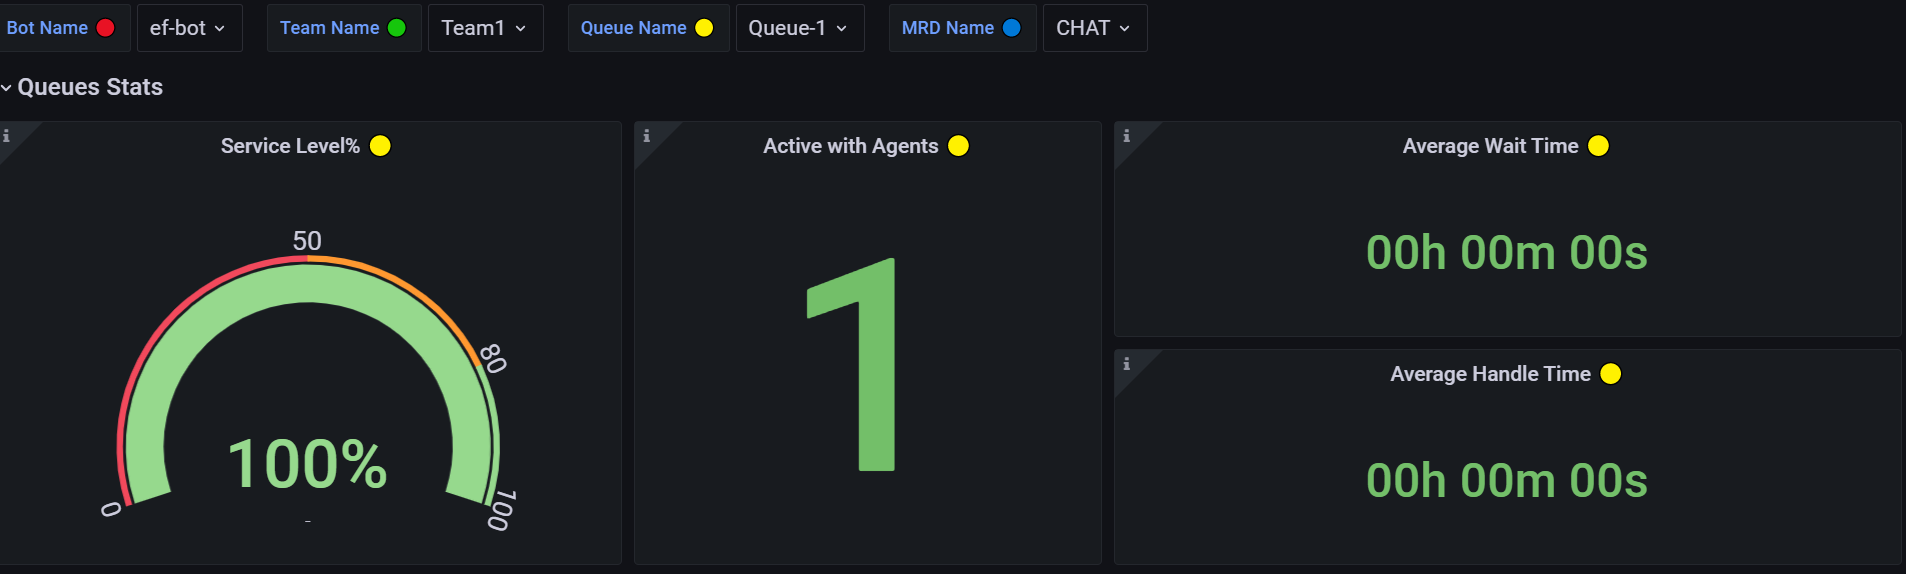
The summary dashboard shows the summary statistics of all conversations being queued, active with agents/bots and the overall agent states on the MRDs. With the new team-based implementation, supervisors can now see the Team filter which allows supervisors to switch between the teams to select the desired team. Based on the specified team, they can then select the queue to monitor the queue statistics that are part of the supervisor's team.
To see the conversations on the dashboard, use the following filters in the sequence:
-
Bot Name - Choose the name of the bot from the dropdown
-
Team Name - Choose one team from the dropdown to see the associated queues. This allows supervisors to view the queues linked to the teams under their supervision.
-
Queue Name - Based on the Team's selection, the Queues dropdown populates the queue(s) that are associated with the specified Team. Once the queue is selected, the data on the dashboard is filtered based on the selected queue.
-
MRD Name - Based on the Team's selection, choose one MRD to see the current MRD states of those agents that are part of the supervisor's team.
Limitation
-
Adding or removing agent attributes that affect queue associations will take effect upon the agent's next login, not in real-time on dashboards.
This dashboard is designed within Grafana and is available out-of-the-box with the deployment of Expertflow CX.
Each different widget on this dashboard is termed a Panel in Grafana.
The dashboard contains three rows where related data is grouped under each row.
Those three rows are:
-
Queue Stats
-
Agent Stats
-
Bot Stats
See the following sections to know more about the panels grouped under each row.
Queue Stats
The following table describes the information about each panel grouped under the row:
|
Panel |
Description |
||||||||||||||||||||
|---|---|---|---|---|---|---|---|---|---|---|---|---|---|---|---|---|---|---|---|---|---|
|
Service Level% |
Shows the Service Level % of a queue based on the Queues filter given on top of the dashboard. This data is retrieved from the historical database which is why, it gets updated after the historical reporting interval. The reporting interval is configurable. By default ,it is set to 5 minutes. This is calculated based on the Service Level Type set in the queue definition by the administrator. See more on Reporting Database Schema -> Key Reporting Concepts to learn more about this parameter. |
||||||||||||||||||||
Active with Agents
|
Shows a number of active conversations that are currently active with agents of the selected team. This data is currently filtered based on the queue that is selected from the queue filter on top of the dashboard, showing the conversations of the queue that are currently active with agents. |
||||||||||||||||||||
|
Average Wait Time |
This is the time duration when the request remains in the queue. An average waiting time is calculated by summing all the waiting times and dividing them by the sum of all chats. Its format is hours minutes seconds (00h 00m 00s) |
||||||||||||||||||||
|
Average Handle Time |
This determines the average handle time of all closed tasks regardless of any disposition This duration is calculated as: task_end_time - task_answered_time In case if a conversation is joined and handled by multiple agents, the conversation's total handled duration is a sum of the handle durations of all agent tasks (created for each agent who joined the conversation). The average handled duration is calculated as:
Format: hours minutes seconds (00h 00m 00s)
|
||||||||||||||||||||
|
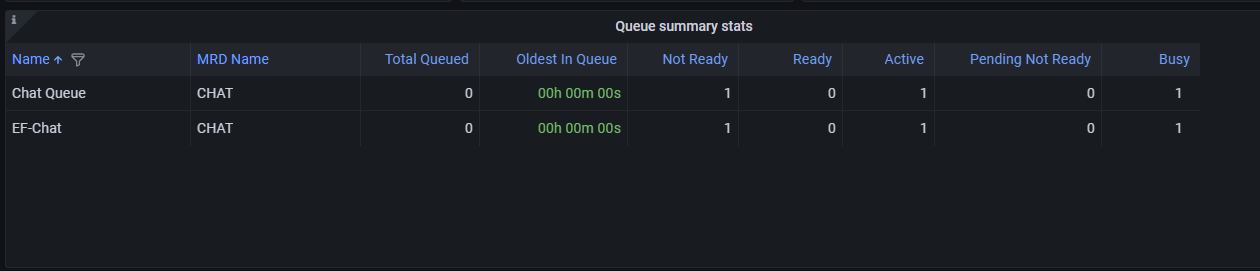
Queue Summary Statistics |
This panel lists all queues in a tabular representation with a summary statistics of each queue including total queued, and the oldest in the queue.
With a queue filter dropdown, select a queue name from the list to filter out the data. You can select one or multiple desired queues to be shown under this panel. You can also apply sorting on the queue name to render queue list in alphabetical order. |
Service Level%, Average Wait Time and Average Handle Time data are based on historical data and therefore, is updated only in the historical reporting interval (aka ETL job interval). The default interval is set to 5 minutes, however, this setting is configurable and can be changed as required by the business.
Agent States
This panel shows a pie chart where each slice of the pie shows the count of agents in each MRD state. This data is filtered using the MRDs filter dropdown on top of the dashboard.
.png?cb=cef2ca48d75935a5575030e3469661ab)
Bot Stats
This panel shows a number of active conversations that are currently active with the bot. This data is filtered using the Bots filter dropdown on top of the dashboard.
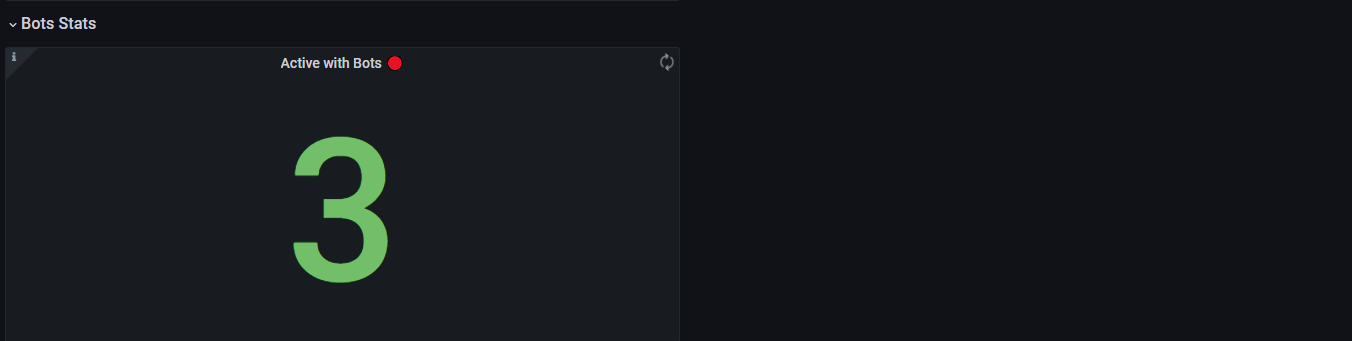
Currently, the software only supports having one bot. When multiple bots support will be added in future, this filter can be used to filter conversation active with a specified bot.
A conversation is considered to be active with the bot unless it is joined by some agent
Detailed Dashboards
The following dashboards are the dashboards where the details of a conversation are listed. The application offers the following three types of detailed views:
Queued Conversations Detail
This dashboard lists all conversations that are currently enqueued to a queue. With the implementation of team-based, supervisors can see the details of a queued conversation of one or multiple queues that are a part of a supervisor's team.
To see the desired conversation on this dashboard, use the following filters in the given sequence:
-
Team - Choose one team from the dropdown to see the relevant queues in the Queues dropdown. This allows supervisors to view conversations in the queues that they supervise.
-
Queue(s) - Based on the Team's selection, the Queues dropdown populates the queue(s) that are associated with the specified Team. Once the queue is selected, the data on the dashboard is filtered based on the selected queue. The dashboard will display data from all queues by default when a supervisor selects any team from the teams dropdown.
The following details of a conversation are available on the dashboard:
|
Field |
Description |
|---|---|
|
Customer |
Name (if identified) along with the customer channel identifier and a channel type icon to identify from which channel the customer initiated the conversation. |
|
Waiting Since |
This is the time since this conversation is enqueued. This time is shown in terms of minutes, such as <x> minutes ago. |
|
Queue Name |
The name of the queue where the conversation is enqueued |
You can change the queue from the Queues filter dropdown to see enqueued conversations on the specified queue.
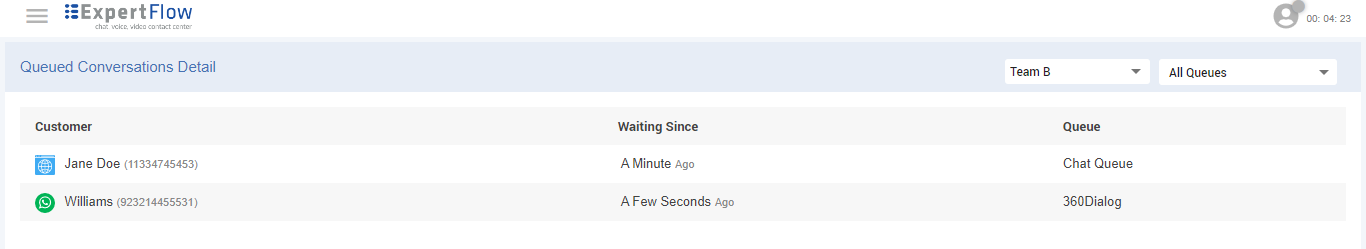
The dashboard automatically gets refreshed after every 10 seconds.
The filter of all queues shows all queues that are part of the supervisor’s team. This does not mean that this filter shows all the queues of the contact center.
Limitation
-
Adding or removing agent attributes that affect queue associations will take effect upon the agent's next login, and not in real-time on dashboards.
Active Conversations Detail
This dashboard lists all conversations that are currently active with agents or bots. With the Team-based implementation, supervisors can now see the details of an active conversation of one or multiple queues that are a part of the supervisors' team.
To see the desired conversations on this dashboard, use the following filters in the given sequence:
-
Answered by Agents or Bots - To see active conversations with bots, switch the value in the first tab of the top row, and set the filter to Answered by Bots. By default, it is set to Answered by Agents which shows the active conversations that are currently active with agents.
-
Team - Choose one team from the dropdown to see the relevant queues in the Queues dropdown. This allows supervisors to view active conversations in the queues that they supervise.
-
Queue(s) - Based on the Team's selection, the Queues dropdown populates the queue(s) that are associated with the specified Team. Once the queue is selected, the data on the dashboard is filtered based on the selected queue. Supervisors can also choose multiple queues in the filter.
The following details of a conversation are available on this dashboard:
|
Field |
Description |
|---|---|
|
Direction |
This shows the direction of the conversation, i.e. if it is Inbound or Outbound. |
|
Channel |
This is the channel through which the customer has initiated the conversation. For instance, WhatsApp, Facebook, Webchat. |
|
Customer |
Name (if identified) along with the channel identity (for instance, WhatsApp number, Facebook name, Email) |
|
Active Since |
This is the time since this conversation became active. This time is shown in terms of minutes, such as <x> minutes ago. |
|
Agent |
This shows Agent's name along with its ID who handled the conversation. |
|
Queue Name |
The name of the queue on which in the conversation is enqueued |
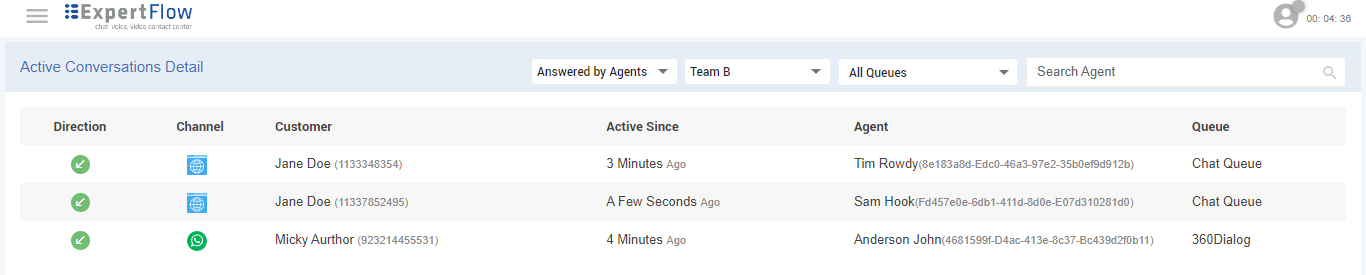
The dashboard gets refreshed after every 10 seconds.
-
A conversation might appear on Active Conversations Detail → Answered by Bots and Queued Conversations Detail at the same time. This is when it is still with the bot and not yet routed to an available agent from the queue. However, as soon as it is routed to an agent, it disappears from the Queued Conversations Detail dashboard.
-
In case of a conversation which is active with any agent of the queue who is not part of the supervisor's team, the conversation will not be visible to the supervisor on the dashboard and will only be seen by the person who is the supervisor of that agent.
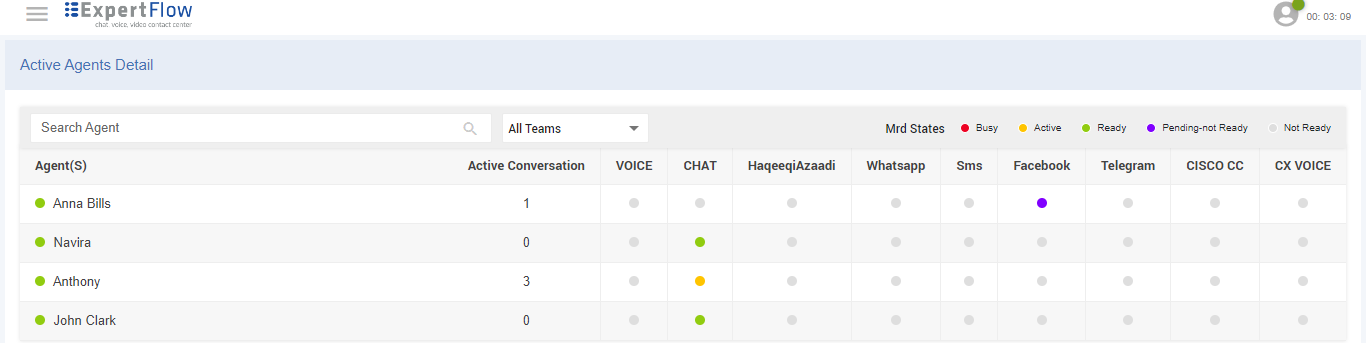
Active Agents Detail
This dashboard shows the list of all agents with a count of active conversations with each agent based on the selected team along with the current state of the agent in each MRD.
To see the desired conversations on this dashboard, use the following filters:
-
Search Agent - This filter allows the supervisor to search for a specific team agent.
-
Team - Choose one team from the dropdown to see the active agents' details and the current state of agents in each MRD.
The following details are available on the dashboard.
|
Field |
Description |
|---|---|
|
Agent (s) |
shows the name of an agent along with the current state Ready, Not Ready |
|
Active Conversation |
shows the number of active conversations going on with the agent for the selected queue. |
|
MRD State |
displays the current state of the agent in a particular MRD Coloured circles on the upper right corner of the dashboard represent the MRD state. For more details of MRD State Transitions see < Agent State -> Change MRD States |
Limitation
-
Adding or removing agents from a team in Keycloak will take effect upon the agent's next login, not in real-time on dashboards.
Silent Monitoring
From the Active Conversation Detail Dashboard, a supervisor is capable to silently monitor a conversation between the agent and the customer to see how the conversation is going on. However, the supervisor can not send a direct message to the customer.
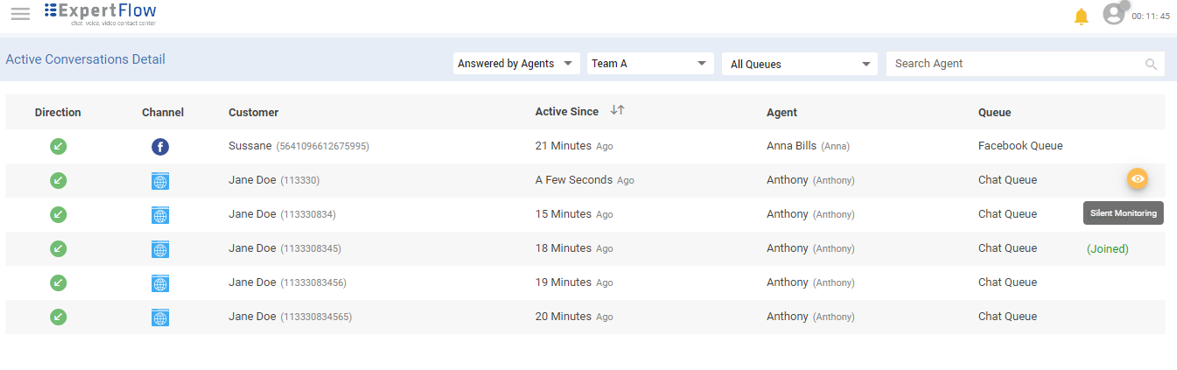
On the left-hand side of the conversation view, active conversations are listed. Supervisors can also see the monitored conversations with an eye icon 
While monitoring the conversation, supervisors can:
-
Exchange the whisper message with the agent using the Whisper tab to assist him without letting the customer know about it. To learn more about how to send Whisper Messages, see Agent Guide -> Send a Whisper Messages
-
Jump into conversations if required by clicking on the Barge-in button at any time.
-
Leave the chat.
While silent monitoring the conversation, supervisors can not:
-
Directly send a message to the customer.
-
Transfer the conversation.
-
Have a conferenced conversation.
Barge in
The supervisor can monitor and barge in a conversation by clicking the Barge in button on the Conversation Toolbar. As she barges in, she becomes a primary participant in the active conversation and can:
-
Send a direct message to the customer using the Customer's tab
-
Exchange the whisper message with the agent using the Whisper tab without letting the customer about it.
-
Transfer the conversation.
-
Leave the chat
To barge in, the supervisor needs to silently monitor a conversation first and then click on the Barge in button to join the conversation.
Team Announcements
Supervisors can create, edit, and delete announcements for their team agents. Announcements are created for team agent(s) to notify the important news or information. Each agent/member of the team receives the announcement except the supervisor who has created the announcement.
-
An agent will receive the announcement on logging in or whenever she is logging in, will receive the announcement until the announcement gets expired.
-
Will not receive the announcement if she is logged out.
Each announcement has its status
Announcement Status
Each announcement is in one of the following status:
|
Status |
Description |
|---|---|
|
Scheduled |
the announcement that is planned to be sent on a scheduled time. |
|
Active |
the announcements that are available for agents to view in their bell notification drop down |
|
Expired |
the announcements that are expired after the expiry time and no more visible in Agent's view. |
Create Announcement
The supervisor can click on the Team Announcement tab from the menu bar on the left side to create a New Announcement.
On clicking 
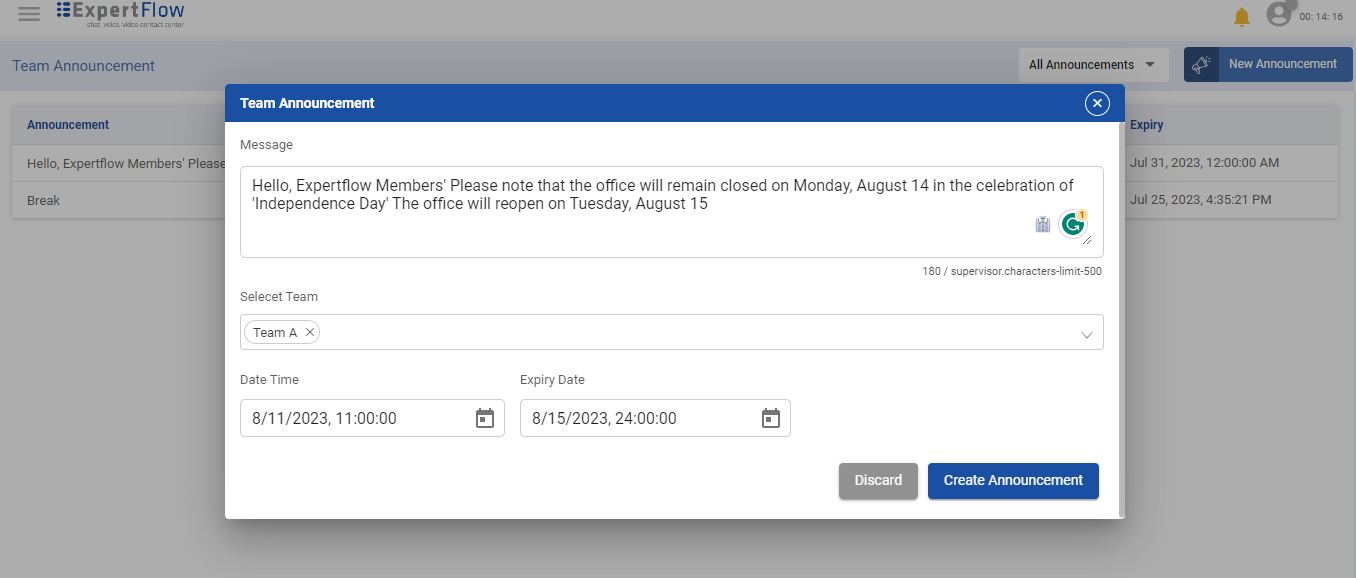
|
Fields |
Description |
|---|---|
|
Announcement Text |
the actual announcement text that should not exceed more than 500 characters |
|
Select Team(s) |
select one, multiple or all of the teams from the Teams dropdown. The supervisor will only be able to see her own team(s) from this dropdown. |
|
Schedule Date/Time |
the date/time when the announcement is triggered and send to all team members. The future date/time can be selected here when the announcement has to be sent to all the team members. By default, it will show the current date/time. |
|
Expiry Date/Time |
the date/time when the announcement expires. When this time reaches, this announcement disappears automatically. By default, the announcement expires in ten minutes. It can be changed and at maximum, it expires within five days from the date of creation. |
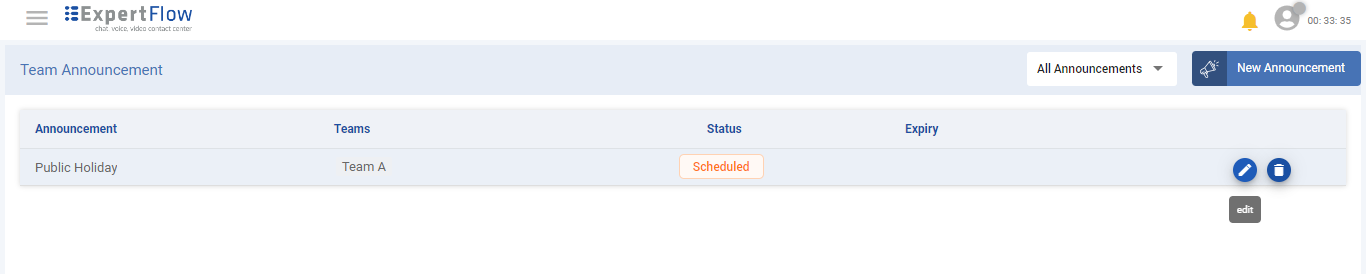
Edit Announcement
The supervisor can only edit and update the Scheduled Announcements and can not edit active or expired announcements. To edit the announcements, hover the mouse over the desired announcement and hit the 
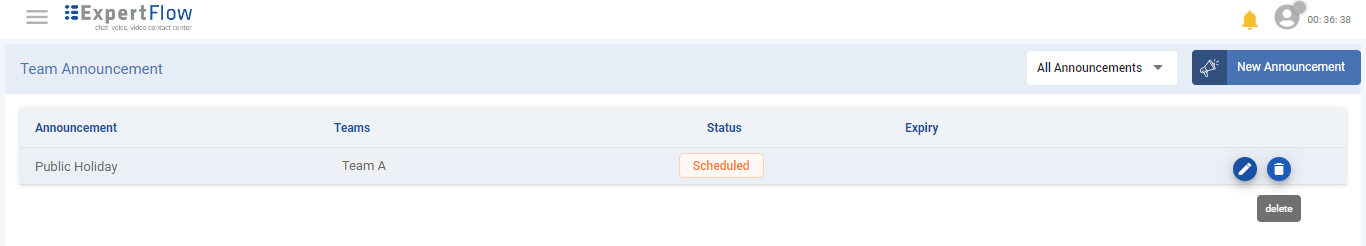
Delete Announcement
Supervisors can delete the announcement that is in:
-
active,
-
scheduled, or
-
expired state
The announcement can be deleted by hovering the mouse over that desired announcement and hit the 
If the supervisor deletes an active announcement, it will be deleted from this list and will also disappear automatically from the agent's view.
Customer List
The Customer List view lists down all customer records.
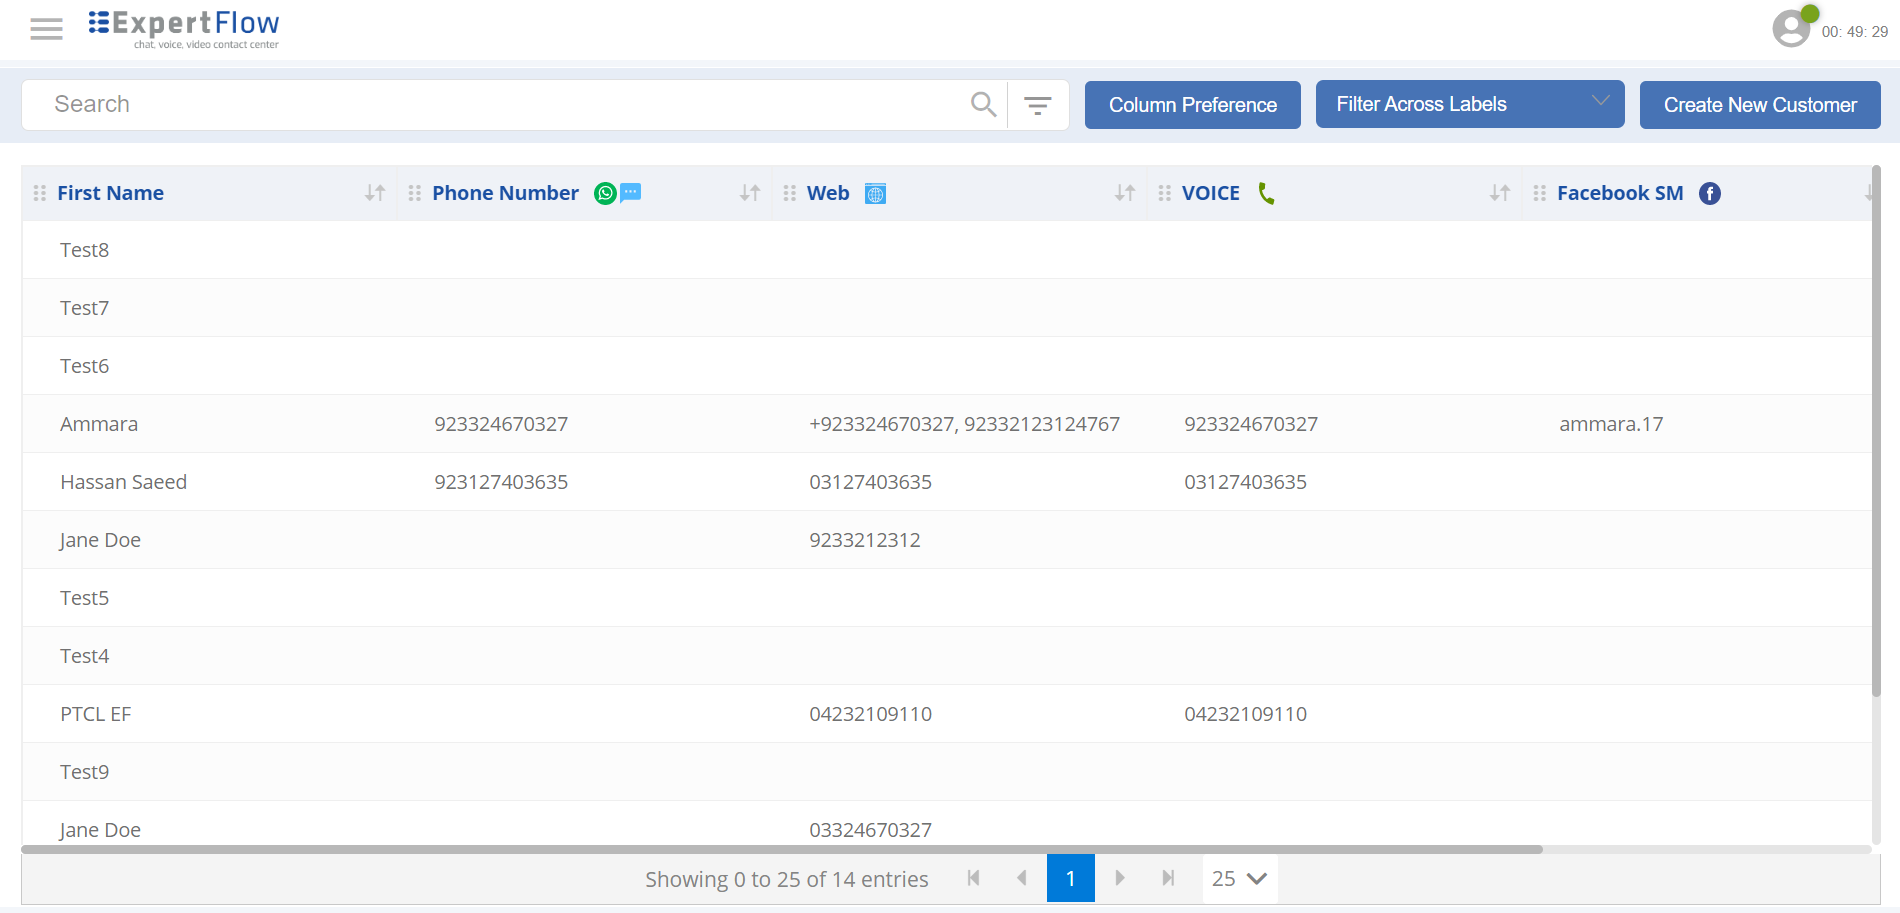
To understand the Customer List and all operations on the List view, see Agent Guide -> Customer List.
Customer Schema
Allows the business administrator or anybody who has permission to customize the Customer fields. See Customer Schema
Subscribed Lists
To understand Subscribed Lists and how to join a pull-based request from a List, see Agent Guide -> Subscribed Lists
End a Pull-based Request
On the Inbox view of a subscribed list, hover the mouse over the conversation that needs to be ended, and click on the End button to end the conversation.
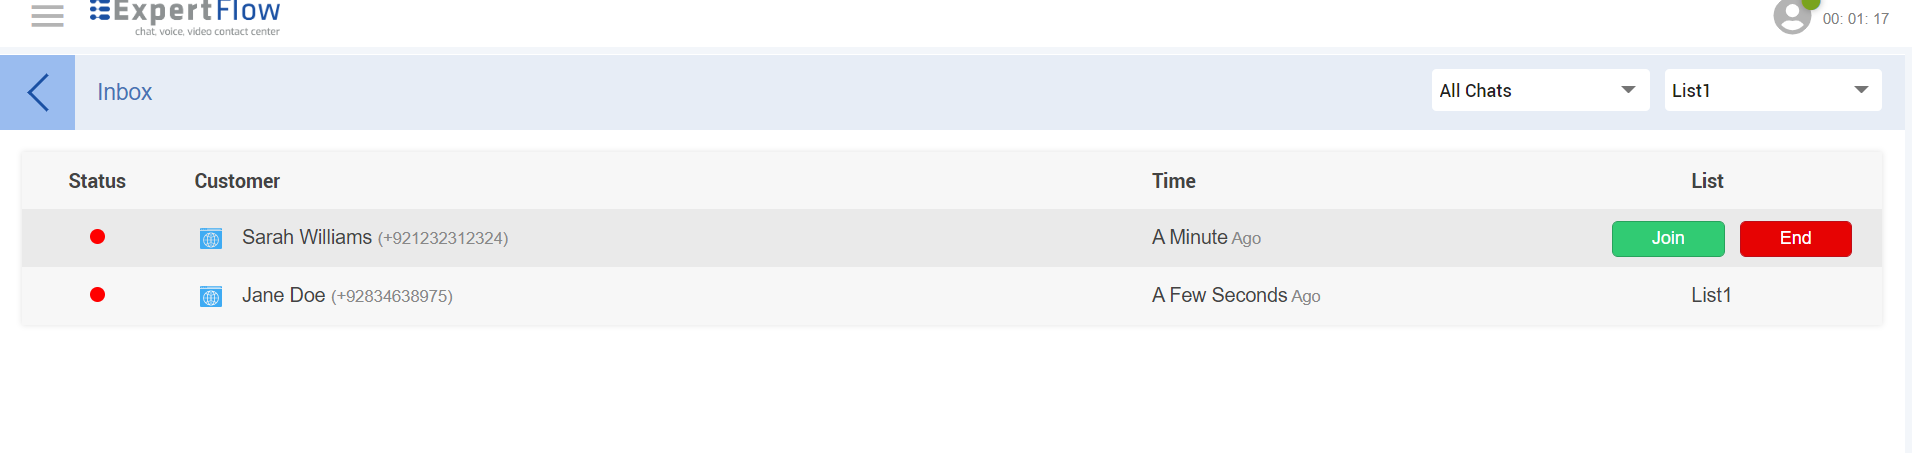
You can only end a conversation if you are granted the relevant permissions to do that. Users having supervisors roles by default have those permissions.
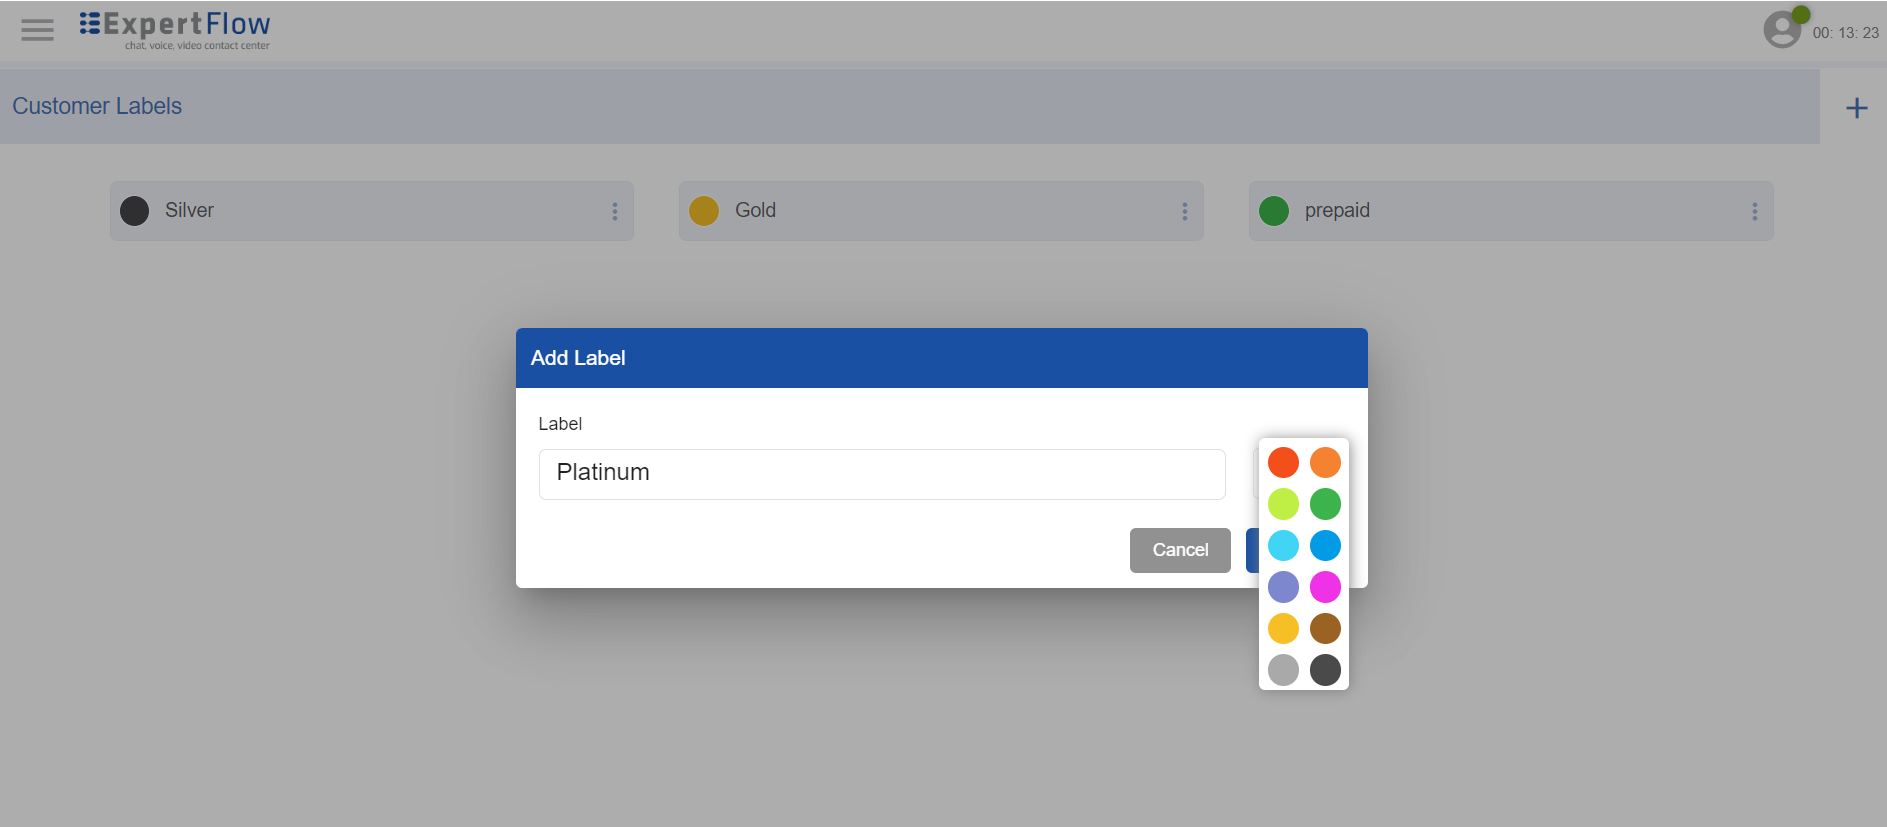
Customer Labels
Customer Labels allow to categorization of customers based on certain characteristics such as customer segment, language, and type (gold, platinum).
To start defining some labels in the system, select Customer Labels from the main menu on the top left corner.
Click the + button to create a new label.
|
Field |
Description |
|---|---|
|
Label |
Give a name to the label. Labels are case-sensitive. Note that a label with the same name cannot be created. |
|
Color |
Choose a color to give a colored representation. |
Customer Labels
Once created, labels are available to agents while assigning them to customers during a customer conversation.
Labels can also be created dynamically while updating a customer's profile. See Agent Guide -> Assign Labels to Customers