
The Operations Dashboard shows call volume and hold metrics for supervisors and admins on Cisco VRS. Open it from the VRS application menu (Operations Dashboard). Choose a date range and optional skill group, then use Apply. Metrics refresh about every five minutes; use Refresh to reload immediately.
Operations Dashboard is available from VRS 14.11.0. Applies to: Cisco UCCE / UCCX (not EFCX). Formal testing was on UCCE; UCCX is supported but was not formally tested in this release.
-
Access: users with the
adminorsupervisorKeycloak realm role. Agents cannot open the dashboard. Ops Dashboard uses the same existingsupervisorrole as Media Recordings (no new role). Role and department setup: VRS Authorization & Permissions and Setup Keycloak for VRS. -
Metrics are calculated at call level (multi-leg sessions count as one interaction).
-
Figures are scoped to the signed-in tenant.
Filters
The dashboard toolbar defines which recorded sessions feed every widget:
-
From — start of the reporting interval
-
To — end of the reporting interval
-
Skill group — optional filter (skill/queue names in range; All skill groups when empty)
The default range is the current day. Change From/To to review other days.
Filters (From, To, Skill group):

Use Skill group to limit all tiles, charts, and the skill table to sessions for that skill/queue only. Clearing the selection returns to all skill groups in the date range.
Skill group dropdown:

Apply and Refresh
After changing From/To and/or Skill group:
-
Apply — reloads metrics for the new filters
-
Refresh — reloads with the current filters (same as a manual poll)
Auto-refresh runs about every 5 minutes. On failure, the last successful data stays on screen with an error hint. The Updated indicator shows the last successful refresh time.
Apply and Refresh after filter changes:

KPI widgets
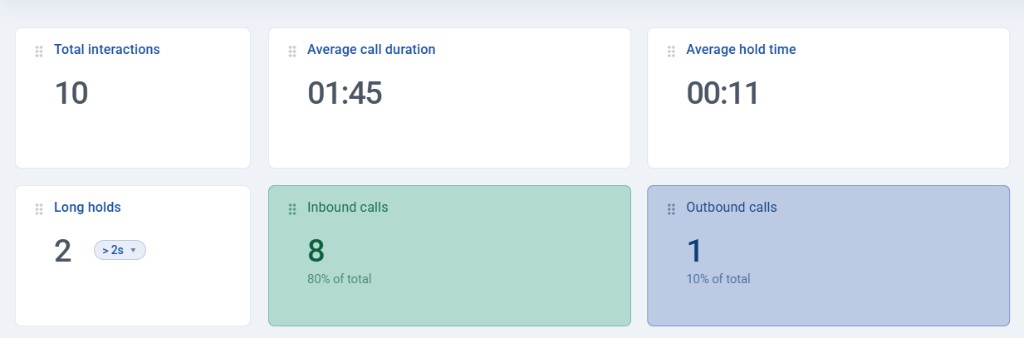
The top KPI cards give at-a-glance ops health for the selected period:
|
Widget |
Meaning |
|---|---|
|
Total interactions |
Count of recorded calls in the interval (and skill filter, if set) |
|
Average call duration |
Mean call duration (formatted mm:ss / hh:mm:ss) |
|
Average hold time |
Mean hold time across sessions with hold data |
|
Long holds |
Count of calls whose hold time is above the selected threshold. Threshold options are 2 / 4 / 6 / 8 / 10 seconds ( |
|
Inbound calls |
Count of inbound direction calls |
|
Outbound calls |
Count of outbound direction calls |
Six KPI widgets:
Call direction
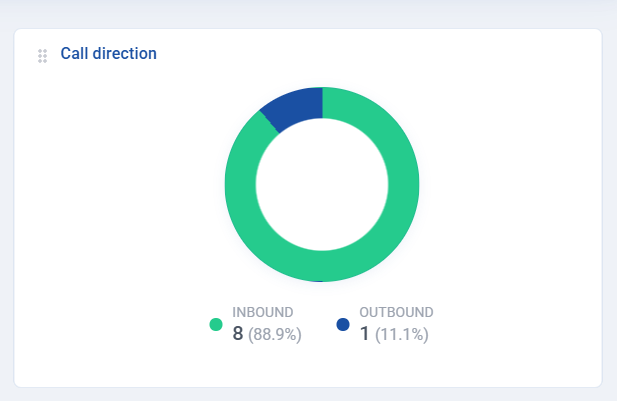
The Call direction chart shows Inbound and Outbound (and Other if present), with counts and percentages for the same filters as the KPI cards.
Call direction chart:
Interactions by hour
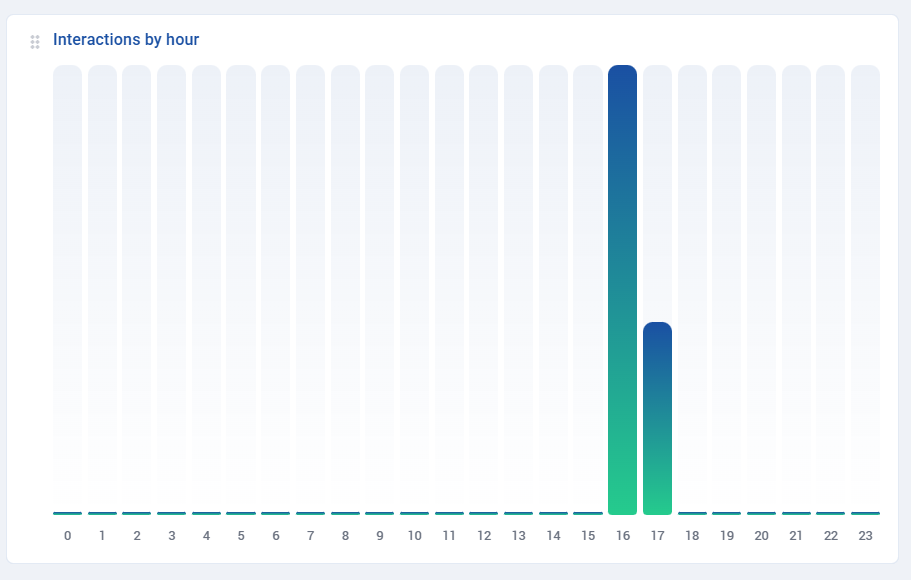
The Interactions by hour chart shows hours 0–23 for how traffic is distributed across the day. For multi-day ranges, values are averaged per hour-of-day; empty hours show as zero. Hours follow the VRS server / configured application timezone.
Interactions by hour:
Skill groups table
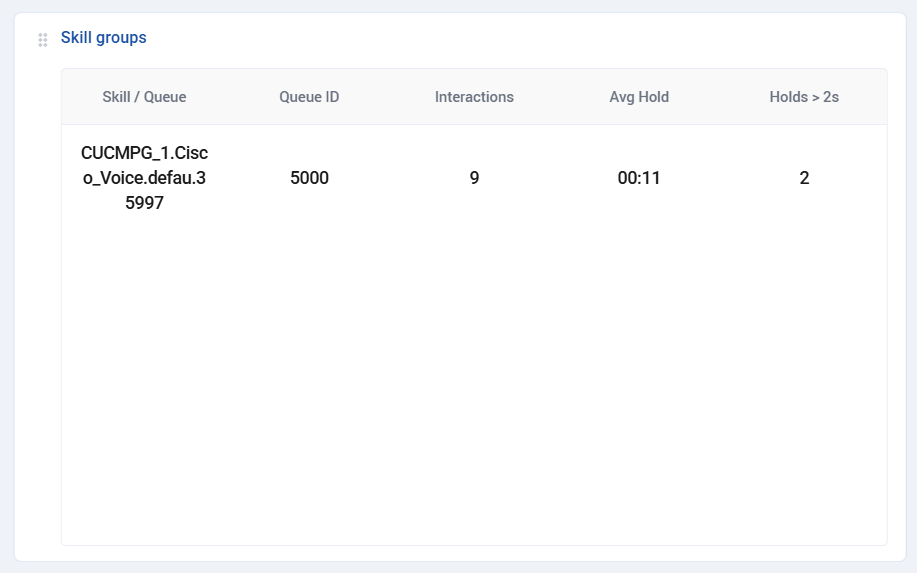
The Skill groups table breaks down volume and hold metrics per Cisco skill/queue. Columns include Skill / Queue, Interactions, Avg duration (when shown), Avg hold, and Long holds.
-
Skill / Queue
-
Interactions
-
Avg duration (or related duration metrics, when shown)
-
Avg hold
-
Long holds (threshold-aware)
Blank or unassigned queues may be omitted from this named-skill breakdown.
Skill groups table:
Limitations
Department groups (/Departments/<name>) apply to Media Recordings only. On the Operations Dashboard, a supervisor sees the same tenant-wide metrics as an admin for the selected date range and skill filter — not only their department. Same realm role, different data scope. Restrict dashboard access by role policy if a tenant-wide ops view is not appropriate for all supervisors.