We have deployed the Prometheus/ Grafana in this article already. Now we are going to add a different dashboard in Grafana. You can access the Grafana UI at https://<hc-host-fqdn>/grafana/
Dashboard for viewing Hybrid Chat Host's Stats
If you want to view only the Hybrid Chat Host stats, you need to first download this dashboard and then import it in Grafana UI.
-
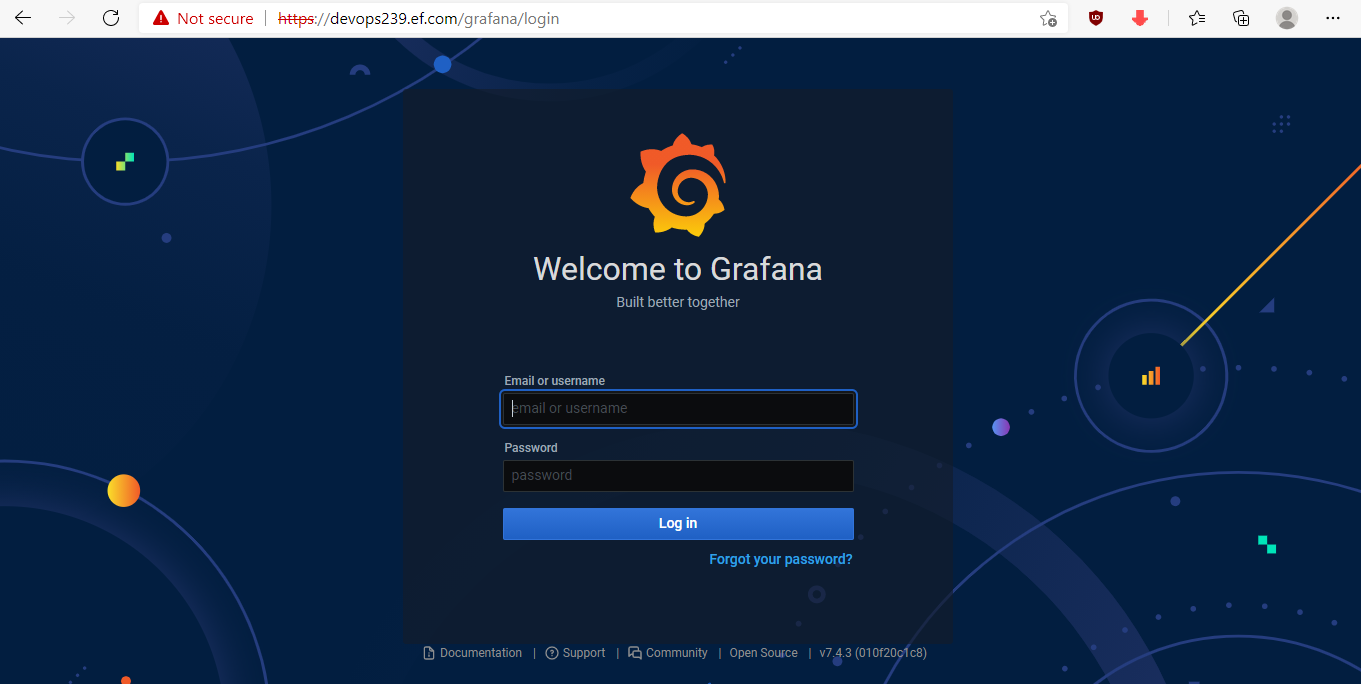
First, we are going to access the Grafana UI, in our example, it will be: https://devops239.ef.com/grafana/. You will be greeted by the login screen of Grafana.
-
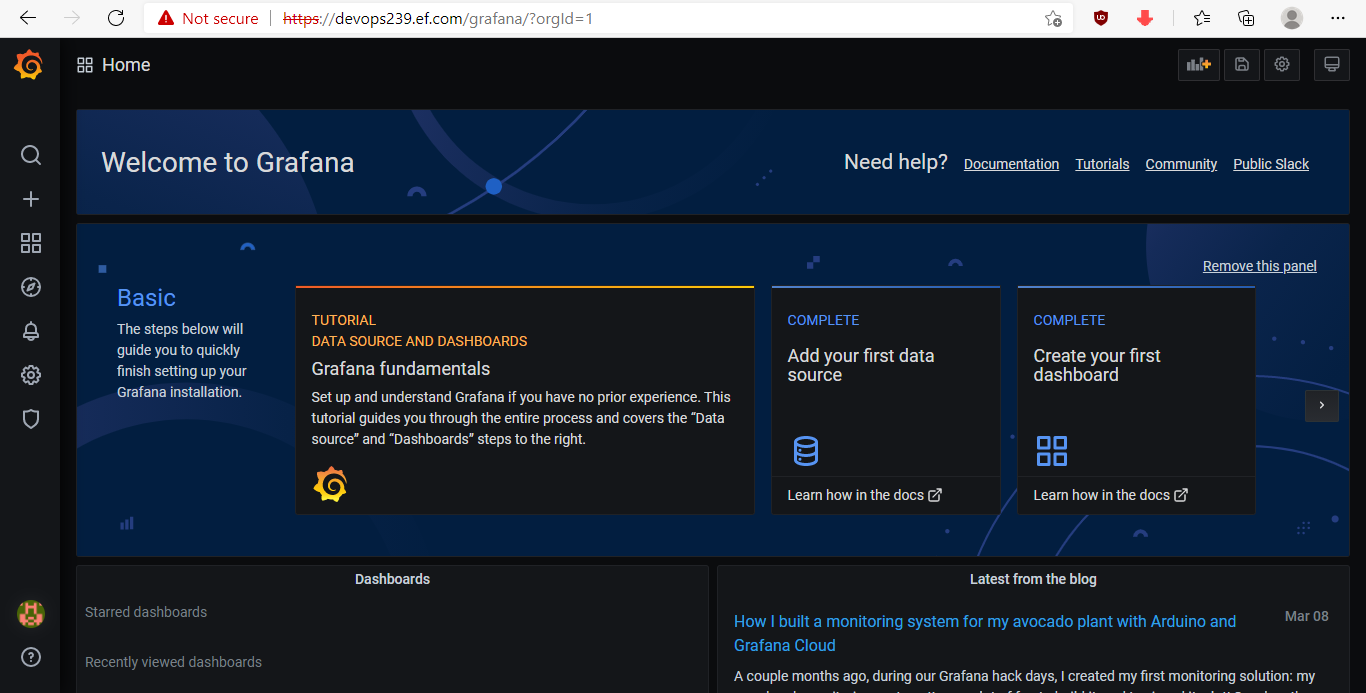
Enter the username and password and you will see the Welcome screen of Grafana
-
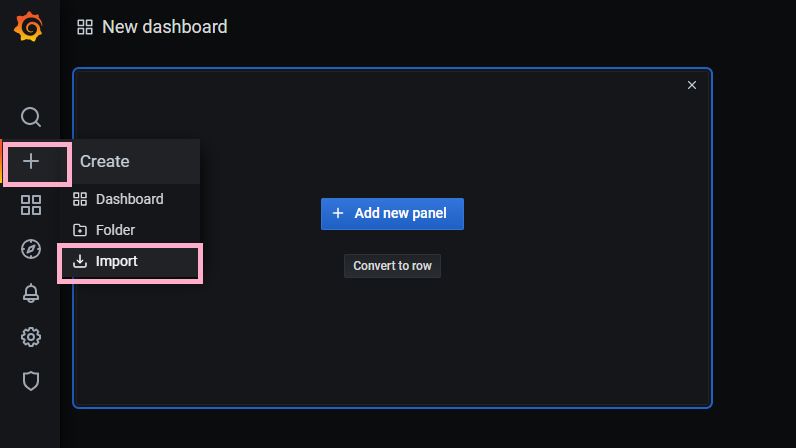
Click on the + icon on the left vertical bar and then click on import.
-
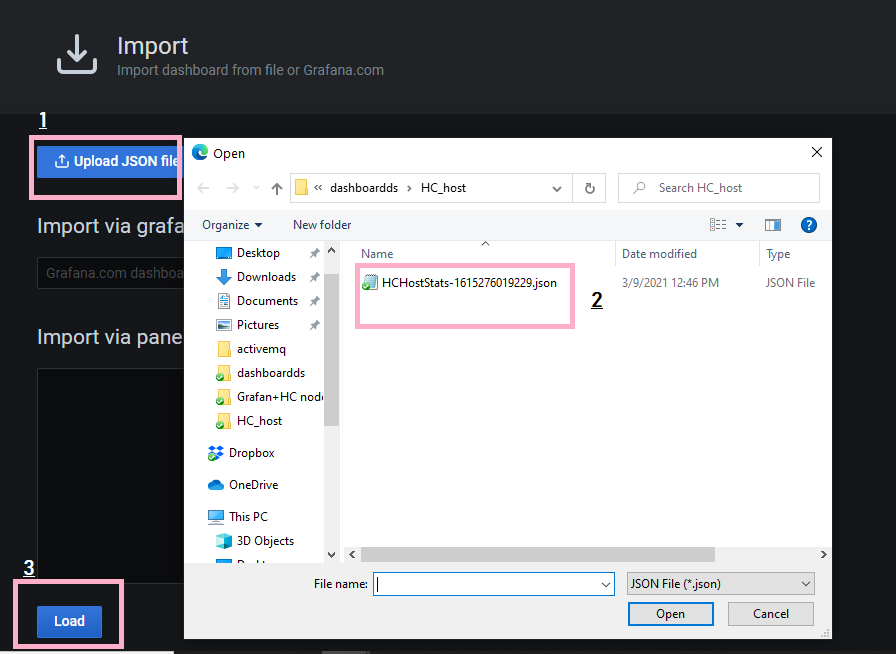
Once the import window is open, click on
Upload JSON file,Select the Dashboard you have downloaded earlier and then click onLoad.
You will see the following screen. Click on Select the Prometheus data Source and then click on import.
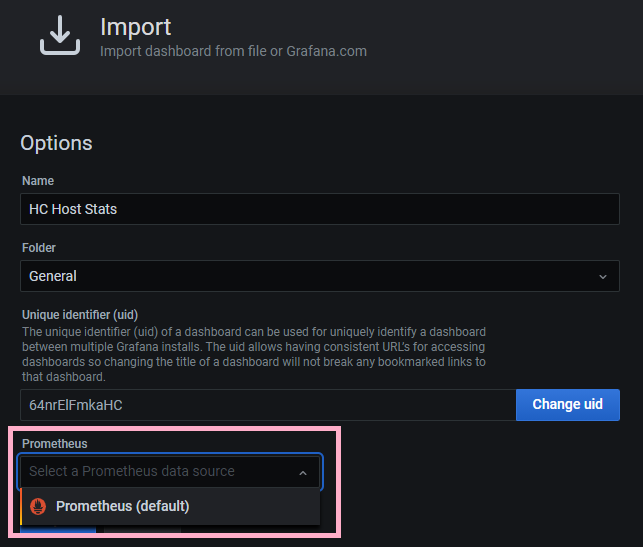
That's it, You now have a working dashboard displaying HC host stats.
If you want to see the stats of Hybrid chat deployed in HA, use this dashboard instead
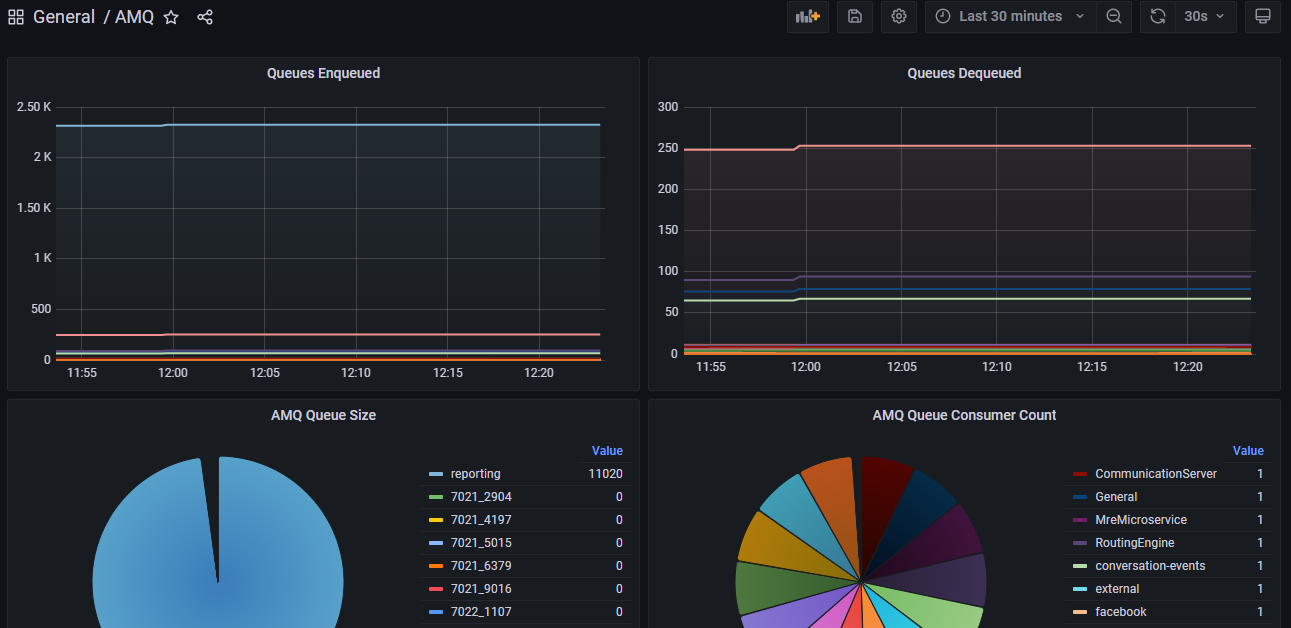
Dashboard for Viewing ActiveMQ Stats
The process of adding a dashboard in Grafana remains the same as above. You just need to download this dashboard and import it.
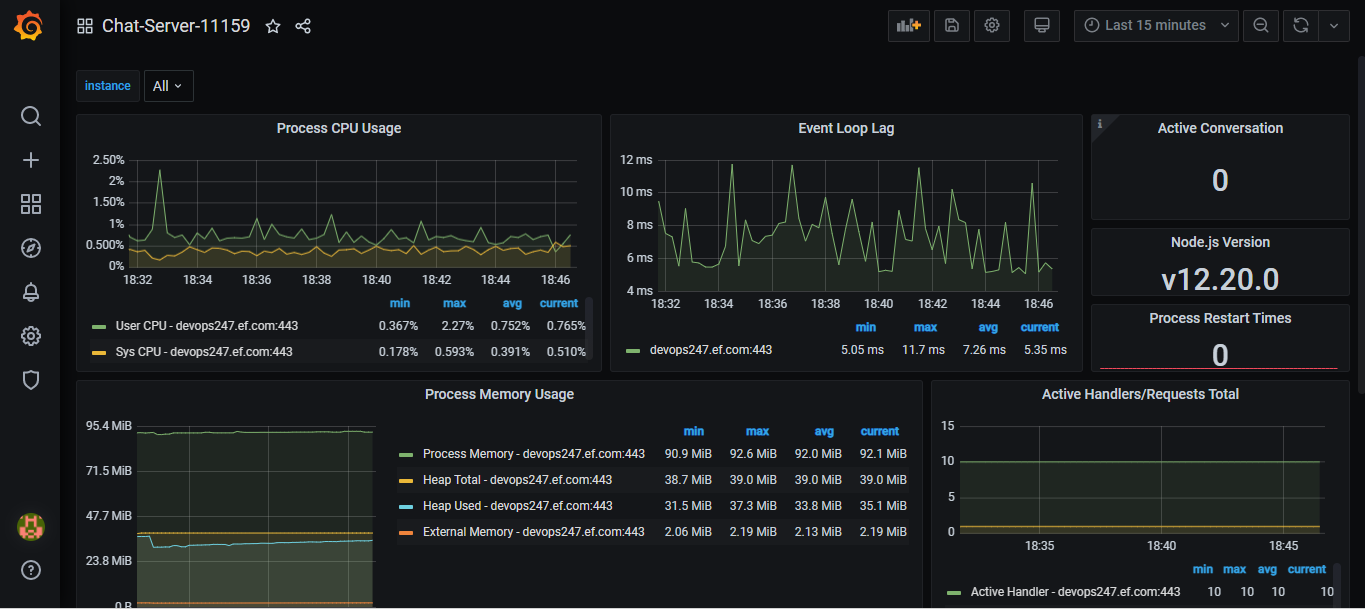
Dashboard for Viewing Chat Server Stats
The process of adding a dashboard in Grafana remains the same as above. You just need to download this dashboard and import it.
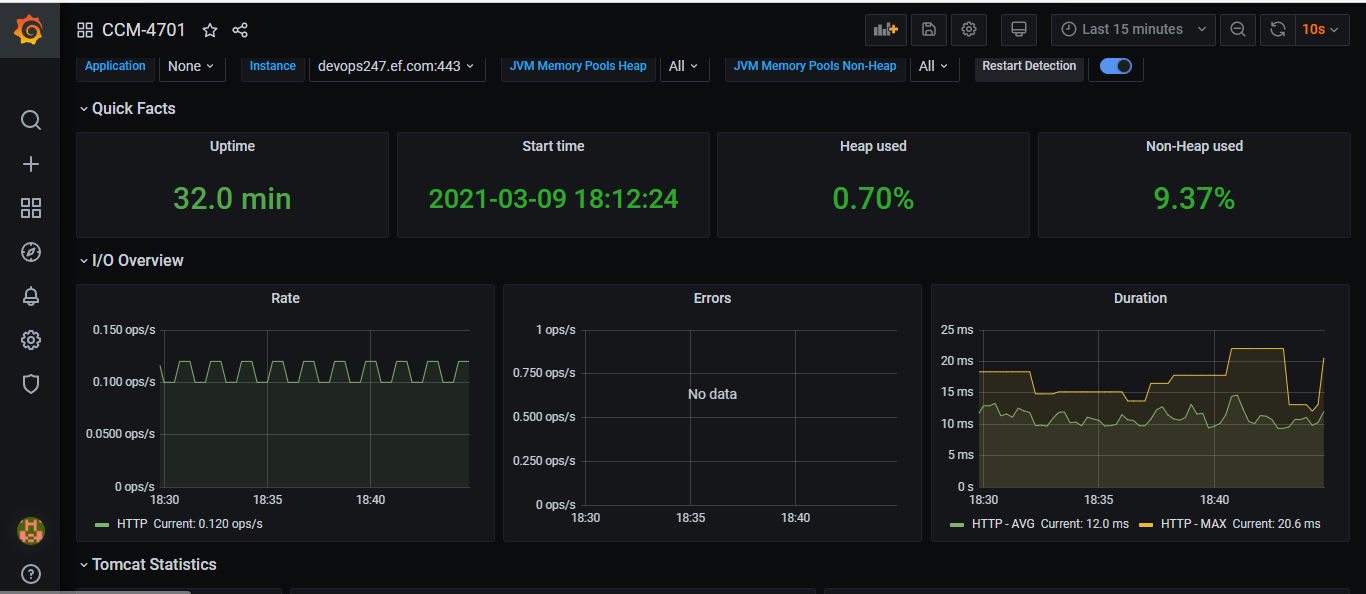
Dashboard for Viewing CCM Stats
The process of adding a dashboard in Grafana remains the same as above. You just need to download this dashboard and import it.
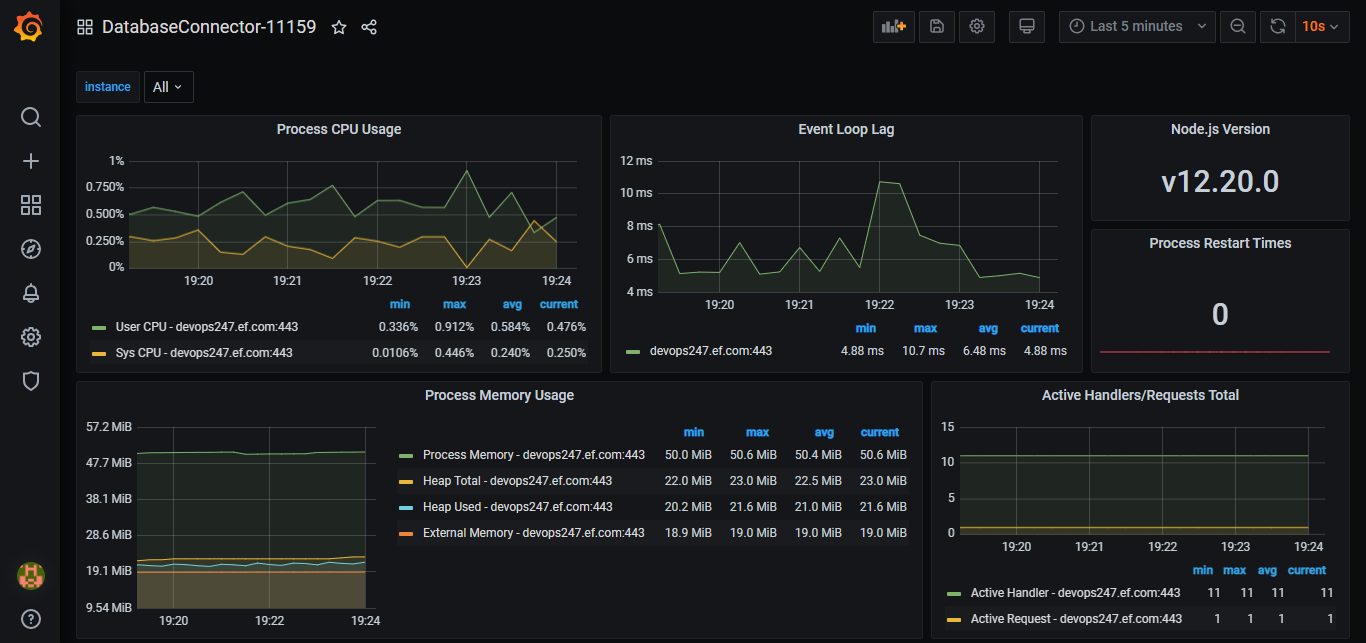
Dashboard for Viewing DB Connector Stats
The process of adding a dashboard in Grafana remains the same as above. You just need to download this dashboard and import it.
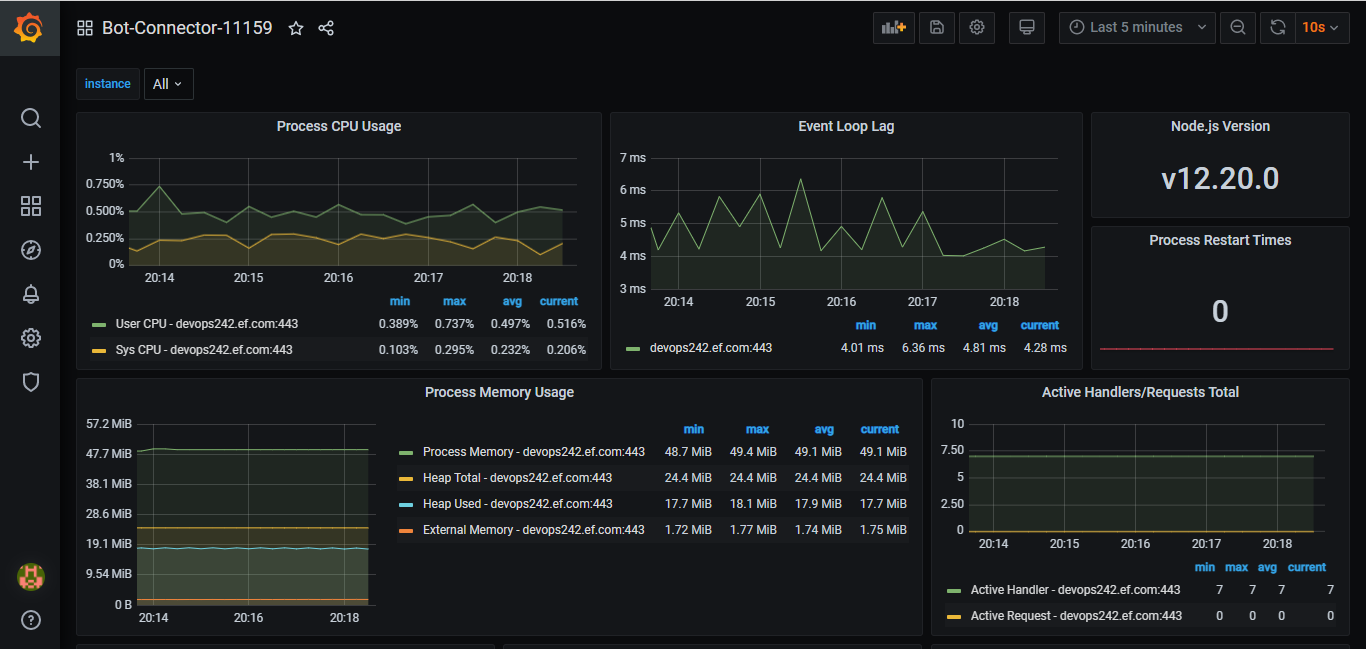
Dashboard for Viewing Bot Connector Stats
The process of adding a dashboard in Grafana remains the same as above. You just need to download this dashboard and import it.
Troubleshooting
Usually, whenever you restart the docker-compose of Prometheus/ Grafana and you import the dashboard, you might get encountered with the following error:
Error updating options: Unable to load datasource meta data
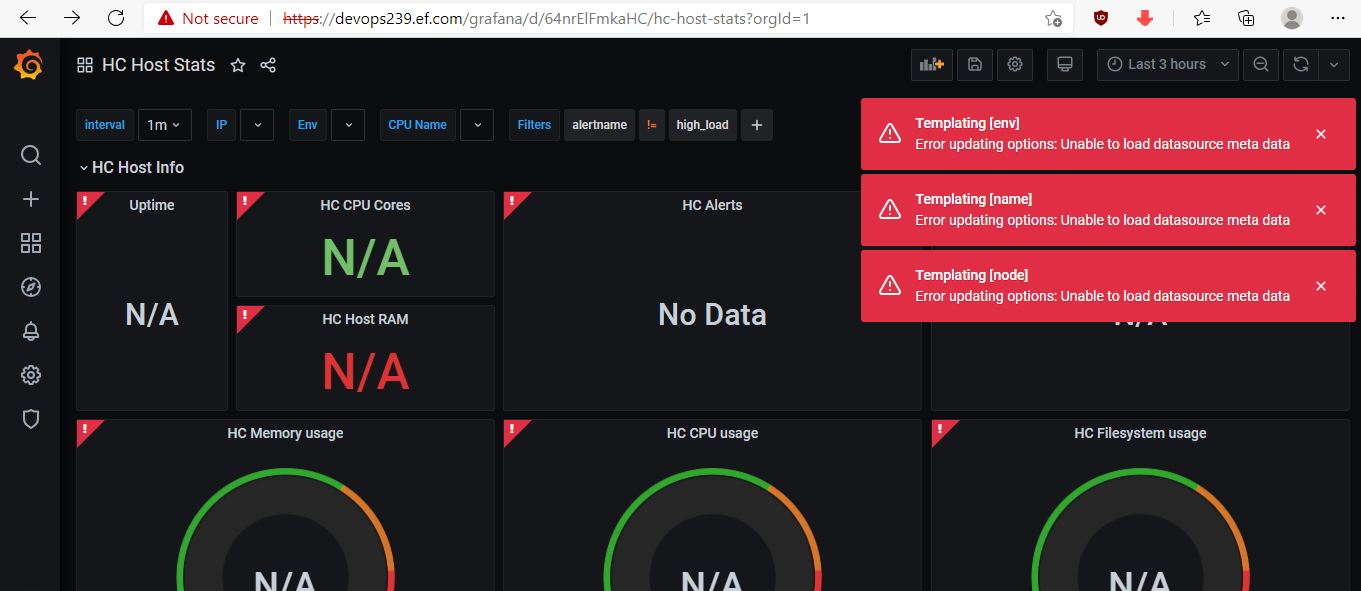
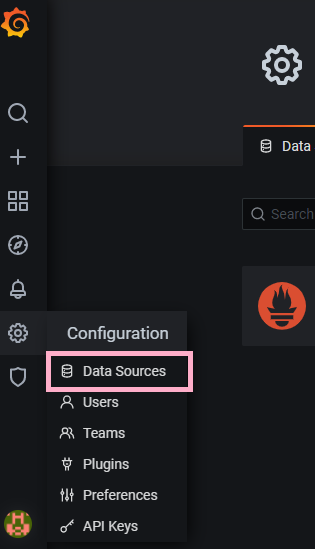
This error is because the Grafana is not able to connect to Prometheus Data Source. To resolve this error, you need to go to settings (icon on the left vertical bar) and click on Data Source
Then click on the Prometheus Data Source and then scroll down all the way to the end of the page and click Save & test.
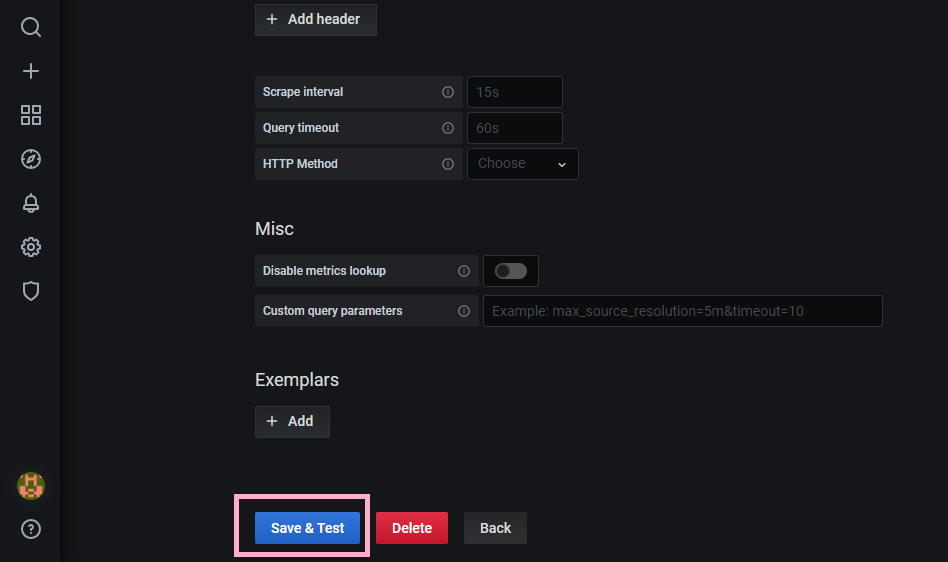
You should see the following success message that the Data source is working.
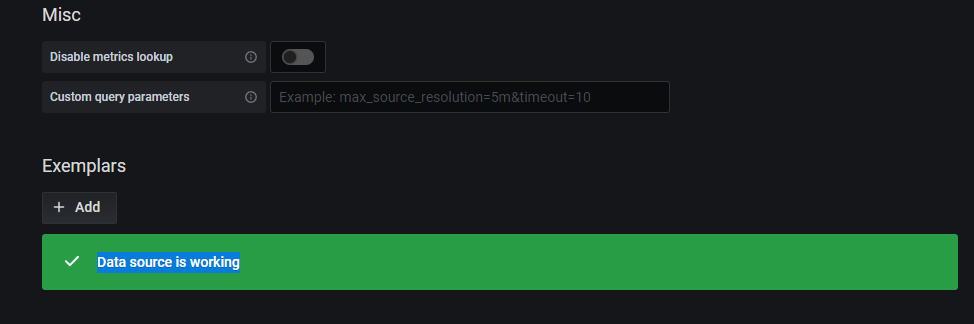
That's it. Now you have a working Dashboard which is connected to Prometheus Data Source