To implement the PIDs in Grafana, we need to deploy Push-gateway that is the utility provided by Prometheus. It is a metrics cache used by individual scripts as a target. A script is run periodically using systemd service and systemd timer to push the certain stats to Pushgateway. Prometheus then collects these metrics from Pushgateway and then we can plot these metrics in Grafana.
This setup is done at the Hybrid Chat Node(s).
Installing Pushgateway
Navigate to Prometheus directory on Hybrid Chat node and vi docker-compose.yml
version: '3.7'
networks:
  chat-solution:
    external: true
services:
  pushgateway:
    image: prom/pushgateway
    restart: always
    ports:
      - "9091:9091"
    networks:
      - chat-solution
save this file and run docker-compose up -d to start the deployment.
Now move back to the /root/ and create a directory named pids by running mkdir /root/pids/ in this directory, create a file named pid.sh by running nano pid.sh and give it executable permissions by running chmod +x pid.sh
Now edit the pid.sh and paste the following code into this file.
#!/bin/bash
z=$(docker stats --no-stream)
while read -r z
do
   var=$var$(awk '{print "pids{process=\""$2"\"}", $14z}');
done <<< "$z"
curl -X POST -H  "Content-Type: text/plain" --data "$var
" http://localhost:9091/metrics/job/top/instance/machine
Save this file and exit.
Now we need to execute this script as a Linux service by systemd utility and run it periodically so that we keep on getting updated stats. To do this, create a service file in systemd by running the following command.
vi /etc/systemd/system/pid_extract.service
Now paste the following code into the file we have just created.
[Unit]
Description=Logs system statistics to the systemd journal
Wants=pid_extract.timer

[Service]
Type=oneshot
ExecStart=/root/pids/pid.sh

[Install]
WantedBy=multi-user.target
save this file and create a new one by running:
vi /etc/systemd/system/pid_extract.timer
Paste the following code into the file.
[Unit]
Description=Logs some system statistics to the systemd journal
Requires=pid_extract.service

[Timer]
Unit=pid_extract.service
OnCalendar=*:0/3

[Install]
WantedBy=timers.target
Save this file and exit.
Now run the following command to start and enable the service.
systemctl daemon-reload
systemctl start pid_extract.service
systemctl start pid_extract.timer
systemctl enable pid_extract.service
systemctl enable pid_extract.timer
We are now done with the setup at the Hybrid Chat node. Now we need to add the service in Prometheus set up to extract the metrics.
Navigate to the VM where Prometheus is setup, Go to the directory, /prometheus/prometheus and open the prometheus.yml file. Add the following piece of code to the file after the alertmanager section.
  - job_name: 'pushgateway'
    scrape_interval: 45s
    static_configs:
         - targets: ['<ip-address>:9091']
We need to provide the IP address of the Hybrid Chat VM where we have deployed Pushgateway.
Save this file and restart the Prometheus by the following command in the root directory of Prometheus.
docker-compose restart prometheus
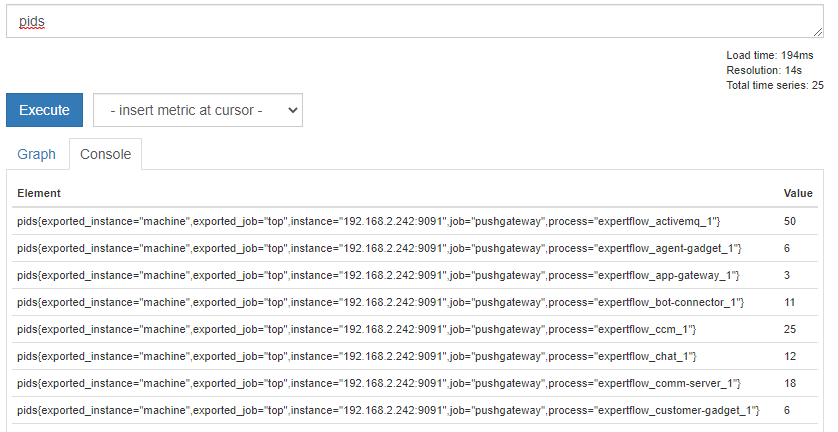
That's it. You now have the stats showing up in Prometheus UI as well.