
|
Report Summary |
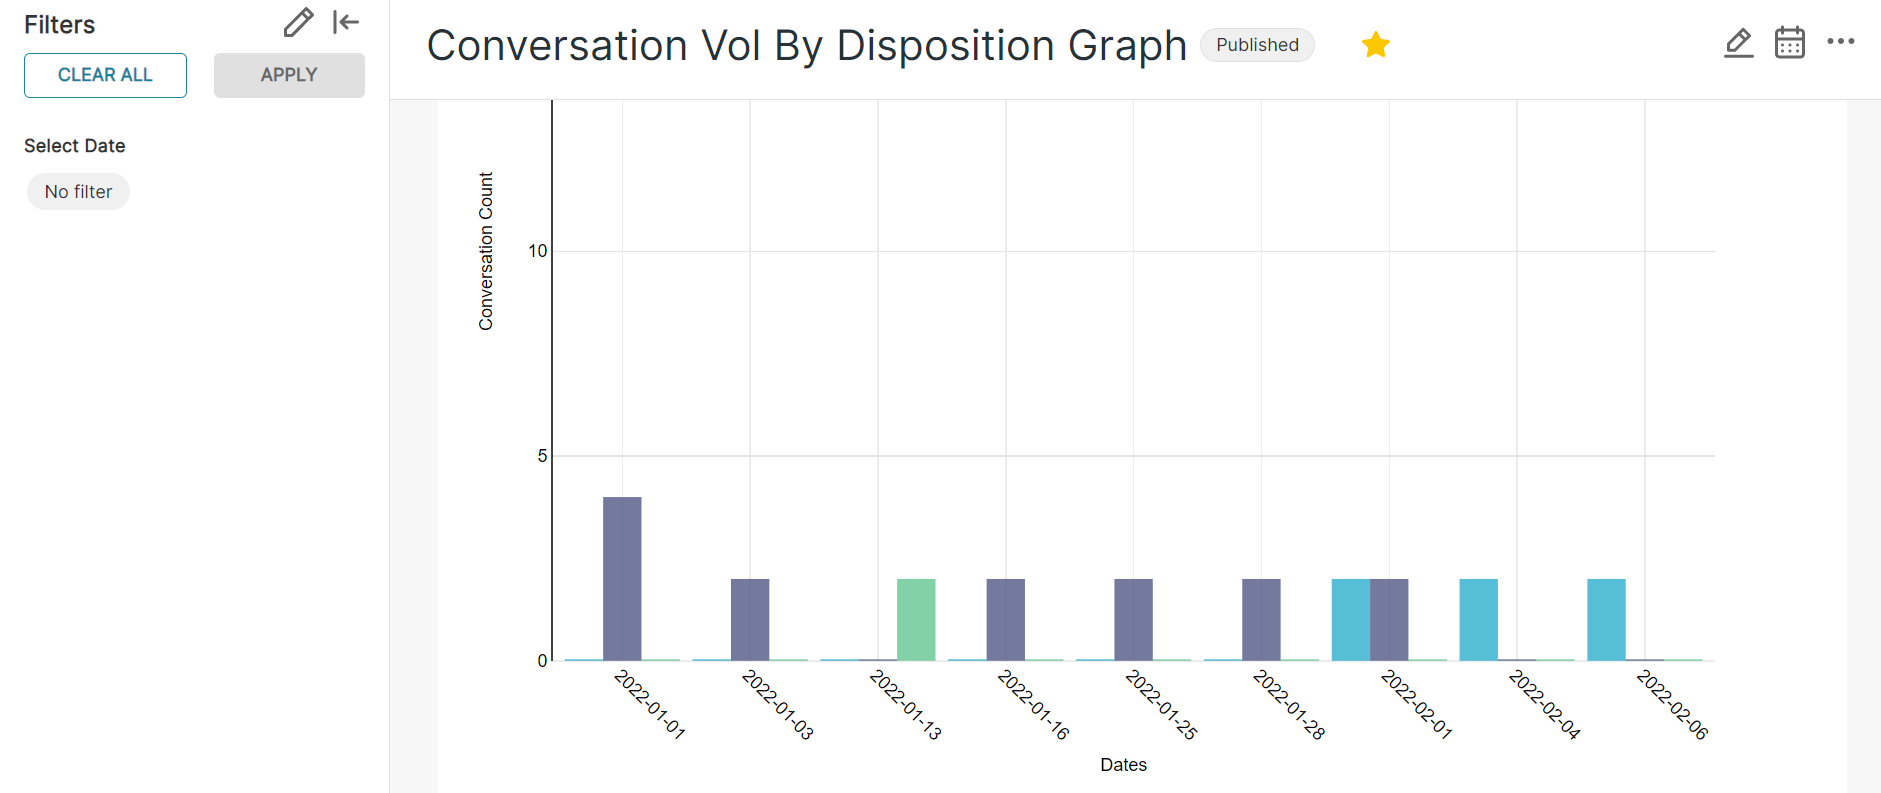
Shows a bar chart display of the total number of conversations handled by Agent, Bot and Network |
|---|
Each bar on the chart shows a count of conversations with the following dispositions:
-
Bot handled
-
Agent handled
-
Abandoned
This helps the business to see the volume of conversations that were handled by a self-service bot, handled by agents, or abandoned by customers.
Report Filters
-
Select Date/time - Based on the date specified in the chart