Overview
Logging and tracing are foundational pillars of observability in modern distributed systems. In a microservices-based architecture, where services communicate across network and process boundaries, traditional debugging approaches are insufficient.
Logging captures discrete events, state changes, errors, and operational metadata generated by services over time.
Tracing provides an end-to-end, time-ordered view of a request as it propagates across multiple services, enabling visibility into latency, dependencies, and execution paths.
In distributed environments where services interact synchronously and asynchronously, observability must provide:
-
Deep visibility into runtime behavior
-
End-to-end request tracking
-
Operational intelligence for proactive monitoring
-
Forensic capability for audits and incident analysis
This document describes the centralized logging and tracing architecture implemented using OpenTelemetry (OTLP) as the standard telemetry format, Fluent Bit as the collection and forwarding agent, and OpenSearch for indexing, storage, and analytics.
The architecture ensures standardized telemetry ingestion, structured indexing, and cross-service correlation across the platform.
As needed, data can be routed to:
-
External/ Third SIEMs: e.g., Splunk
-
EF Log Monitor: Requires custom backend, custom frontend and query layer.
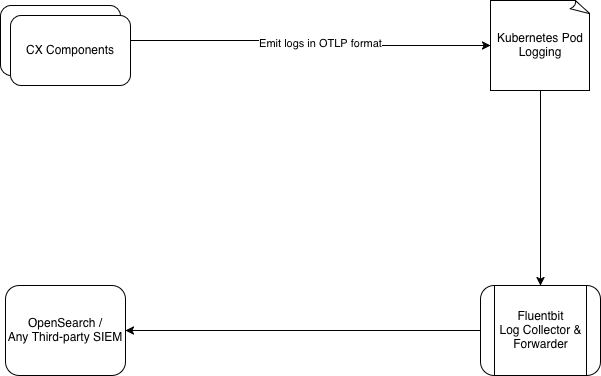
Architecture
Our observability architecture captures and routes log and trace data using a structured, modular pipeline:
Audit Log Generation in the Application
Application components emit logs and traces in standardized OTLP JSON format., which are automatically collected using Kubernetes-native logging mechanisms and forwarded to a central logging system. Audit logs are kept logically separate from standard application logs to allow independent access control, easier review by operations teams, and separate retention policies. Audit events are generated by the application in a structured JSON format. Each audit log includes mandatory attributes to ensure traceability and consistency.
Logging in Kubernetes Pods
Application containers write logs to standard output. Kubernetes handles log persistence at the node level. No audit logs are stored locally inside containers, reducing the risk of loss or tampering due to container restarts.
Log Collection Using Fluent Bit
Fluent Bit is deployed as a DaemonSet within the Kubernetes cluster. This ensures:
-
Logs are collected consistently from all application pods
-
Centralized control over log collection and processing
Log Identification & Filtering
Audit logs are identified using a deterministic field:
"type": "audit_logging"
Tracing logs are identified using a deterministic field:
"type": "tracing"
Filtering Logic
-
All container logs are collected
-
Logs with
type="audit_logging"are filtered into the audit pipeline -
Logs with
type="tracing"are filtered into the tracing pipeline
Routing Logs to Destinations
Log Type
|
Destination
|
|
Audit Logs |
Dedicated audit index / stream
|
|
Tracing Logs |
Dedicated tracing index / stream
|
Storage & Indexing - OpenSearch
OpenSearch acts as the centralized operational data store for logs.
It provides:
-
Scalable storage for high-volume log and trace data.
-
Efficient indexing for fast searches during incidents.
-
Support for high-cardinality fields such as trace IDs and request IDs.
-
Reliable retention and access to historical data for post-incident analysis.
Visualization & Analysis - OpenSearch Dashboards
OpenSearch Dashboards serves as the primary interface to monitor and analyze system behavior. Operational use cases include:
-
Searching and filtering logs in real time.
-
Correlating logs, traces, and audit records using
traceId.
Dashboards can be customized to align with operational workflows and on-call requirements.
Data Retention and Governance
The platform does not enforce data retention policies. All retention, archival, and deletion rules are governed by the destination system (such as OpenSearch or the organization’s SIEM), allowing organizations to align data governance with regulatory, legal, and internal requirements.
Extensibility
The architecture supports:
-
Exporting audit logs to external SIEM platforms
-
Supporting multiple destinations in parallel
Testing and visualization are done using OpenSearch Dashboards.
-
Fluentbit can temporarily store events on disk if OpenSearch is unavailable.
-
Once OpenSearch is back, it automatically forwards the stored data.
-
Good for log-based event ingestion.
Logging Format
Data to be Logged
For each CRUD operation on a configuration item, the following information will be logged:
|
Field |
Type |
Description |
|---|---|---|
|
|
ISO 8601 date |
When the event occurred (UTC timestamps in ISO 8601 format recommended). Example: |
|
|
UUID |
Unique identifier of the user who performed the action |
|
|
string |
Display name of the user |
|
|
keyword |
Operation performed: |
|
|
keyword |
Entity acted upon, e.g. |
|
|
UUID |
Unique identifier of the affected resource |
|
|
IP |
IP address of the user at the time of the action |
|
|
keyword |
Name of the service that emitted the log e.g |
|
|
keyword |
Tenant identifier |
|
|
object |
Snapshot of the changed data (not searchable by design) |
|
|
keyword |
Log category: |
|
|
keyword |
Severity level, e.g. |
Example log entry:
Audit logs will be stored in JSON format. This format is chosen for its flexibility, ease of parsing, and compatibility with OpenSearch.
{
  "timestamp": "2024-11-28T09:00:00Z",
  "user_id": "c7a904cc-262f-41f3-988a-351f6326e004",
  "user_name": "john doe",
  "action": "UPDATE",
  "resource": "teams",
  "resource_id": "3e0b50a2-64fa-4051-8d16-3db6408fddec",
  "source_ip_address": "192.168.1.100",
  "attributes": {
    "service": "unified_admin",
    "tenantId": "expertflow",
    "updated_data": {
      "team_name": "Test team",
      "description": "team for testing teams feature"
    }
  },
  "type": "audit_logging"
}
All the above information is mandatory for logging
Tracing Format
Data to be Logged
For each CRUD operation on a configuration item, the following information will be logged:
|
Field |
Type |
Description |
|---|---|---|
|
|
ISO 8601 date |
When the event occurred (UTC timestamps in ISO 8601 format recommended). Example: |
|
|
UUID |
Unique identifier for a tracing (in our case corelation Id). |
|
|
UUID |
This field indicates the |
|
|
UUID |
Unique identifier for a single operation (a "span") within a trace. |
|
|
keyword |
Status of the log: |
|
|
keyword |
Tenant identifier |
|
|
keyword |
Entity acted upon, e.g. |
|
|
keyword |
Name of the service that emitted the log e.g |
|
|
UUID |
Unique identifier of the user who performed the action |
|
|
string |
Display name of the user |
|
|
UUID |
Unique identifier of the affected resource |
|
|
IP |
IP address of the user at the time of the action |
|
|
string |
Function name where the action occurs |
|
|
keyword |
Log category: |
|
|
keyword |
Severity level, e.g. |
|
|
string |
Description of the event. |
Example log entry:
{
  "timestamp": "2024-11-28T09:00:00Z",
  "trace_id": "abcdef1234567890abcdef1234567890",
  "span_id": "1234567890abcdef", /optional
  "parent_span_id": "abcdef1234567890", /optional
  "service": "unified-admin",
  "tenantId": "expertflow",
  "operation": "create-team",
  "log_level": "INFO",  (INFO, DEBUG, ERROR)
  "message": "Team is saved successfully",
  "status": "OK",   (OK, ERROR)
  "attributes": {
    "source_ip_address": "192.168.1.100",
    "resource_id": "3e0b50a2-64fa-4051-8d16-3db6408fddec",
    "user_id": "user-123",
    "user_name": "test-agent",
    "method_name": "addMemberInTeam"
  },
  "error": {
    "error_code": "MONGO_CONNECT_TIMEOUT",
    "message": "Error occured while saving the team's agent",
    "stack_trace": "Error at saveAgent (teamService.js:45)",
    "cause": "Timeout while communicating with mongoDB"
  },
  "type": "tracing"
}
timestamp, trace_id, service, message, log_level, status, type are mandatory for tracing
Metrics Format
Data to be Logged
For each CRUD operation on a configuration item, the following information will be logged:
-
name: The metric being recorded (
cpu_usage,http_request). -
unit: Measurement unit (e.g.,
%,ms,bytes). -
data_points: List of recorded values (each metric can have multiple timestamps).
-
timestamp: When the data point was captured (UTC timestamps in ISO 8601 format recommended). Example:
2024-11-28T09:00:00Z -
value: The metric’s actual value (75.5% CPU usage).
-
attributes: Extra labels like
host.nameorcontainer_id. -
resource: Identifies the system or service that generated the metric (
system-monitor,web-app)
-
Format
{
  "name": "cpu_usage",
  "unit": "%",
  "data_points": [
    {
      "timestamp": "2024-10-27T10:00:00Z",
      "value": 75.5,
      "attributes": {
        "host.name": "expertflow-test"
      },
      "resource": {
        "service.name": "system-monitor"
      }
    }
  ],
  "type": "metrics"
}
OpenTelemetry Collector, Zipkin, Jaeger, New Relic and Datadog are using the above three JSON for collecting logging, tracing and metrics information.
name, unit and at least one data-point is mandatory for metrics