This guide is intended for Web masters and operations team. It provides a step-by-step process for creating indexes in opensearch to receive logging and tracing data. It explains how you can create the dashboards to visualize the data in Opensearch Dashboards.
Create index in opensearch
Create a script for opensearch index creation with mapping (so all logs go into a properly structured index).
vi opensearch_index.sh
Copy the following code into the opensearch_index.sh file
-
Replace baseURL with the URL/IP of the server where opensearch is deployed
-
Replace INDEX_NAME with
audit_log_indexfor audit logs andtracing_indexfor tracing data
curl -X PUT "http://{{baseURL}}:9200/{{INDEX_NAME}}" \
  -H 'Content-Type: application/json' \
  -d '{
    "settings": {
      "number_of_shards": 3,
      "number_of_replicas": 1
    },
    "mappings": {
      "properties": {
        "timestamp": {
          "type": "date",
           "format": "strict_date_optional_time||epoch_millis"},
        "user_id": { "type": "keyword" },
        "user_name": { "type": "keyword" },
        "action": { "type": "keyword" },
        "resource": { "type": "keyword" },
        "resource_id": { "type": "keyword" },
        "source_ip_address": { "type": "ip" },
        "attributes": {
          "properties": {
            "service": { "type": "keyword" },
            "tenantId": { "type": "keyword" },
            "updated_data": {
              "type": "object",
              "enabled": false  # this will make updated_data field not searchable in dashboard
            }
          }
        },
        "type": { "type": "keyword" },
        "level": { "type": "keyword" }
      }
    }
  }'
run the following commands to execute the script
chmod +x opensearch_index.sh
./opensearch_index.sh
Opensearch Dashboard:
Create an Index Pattern in Dashboards
-
Go to OpenSearch Dashboards →
http://{{baseURL}}:5601. -
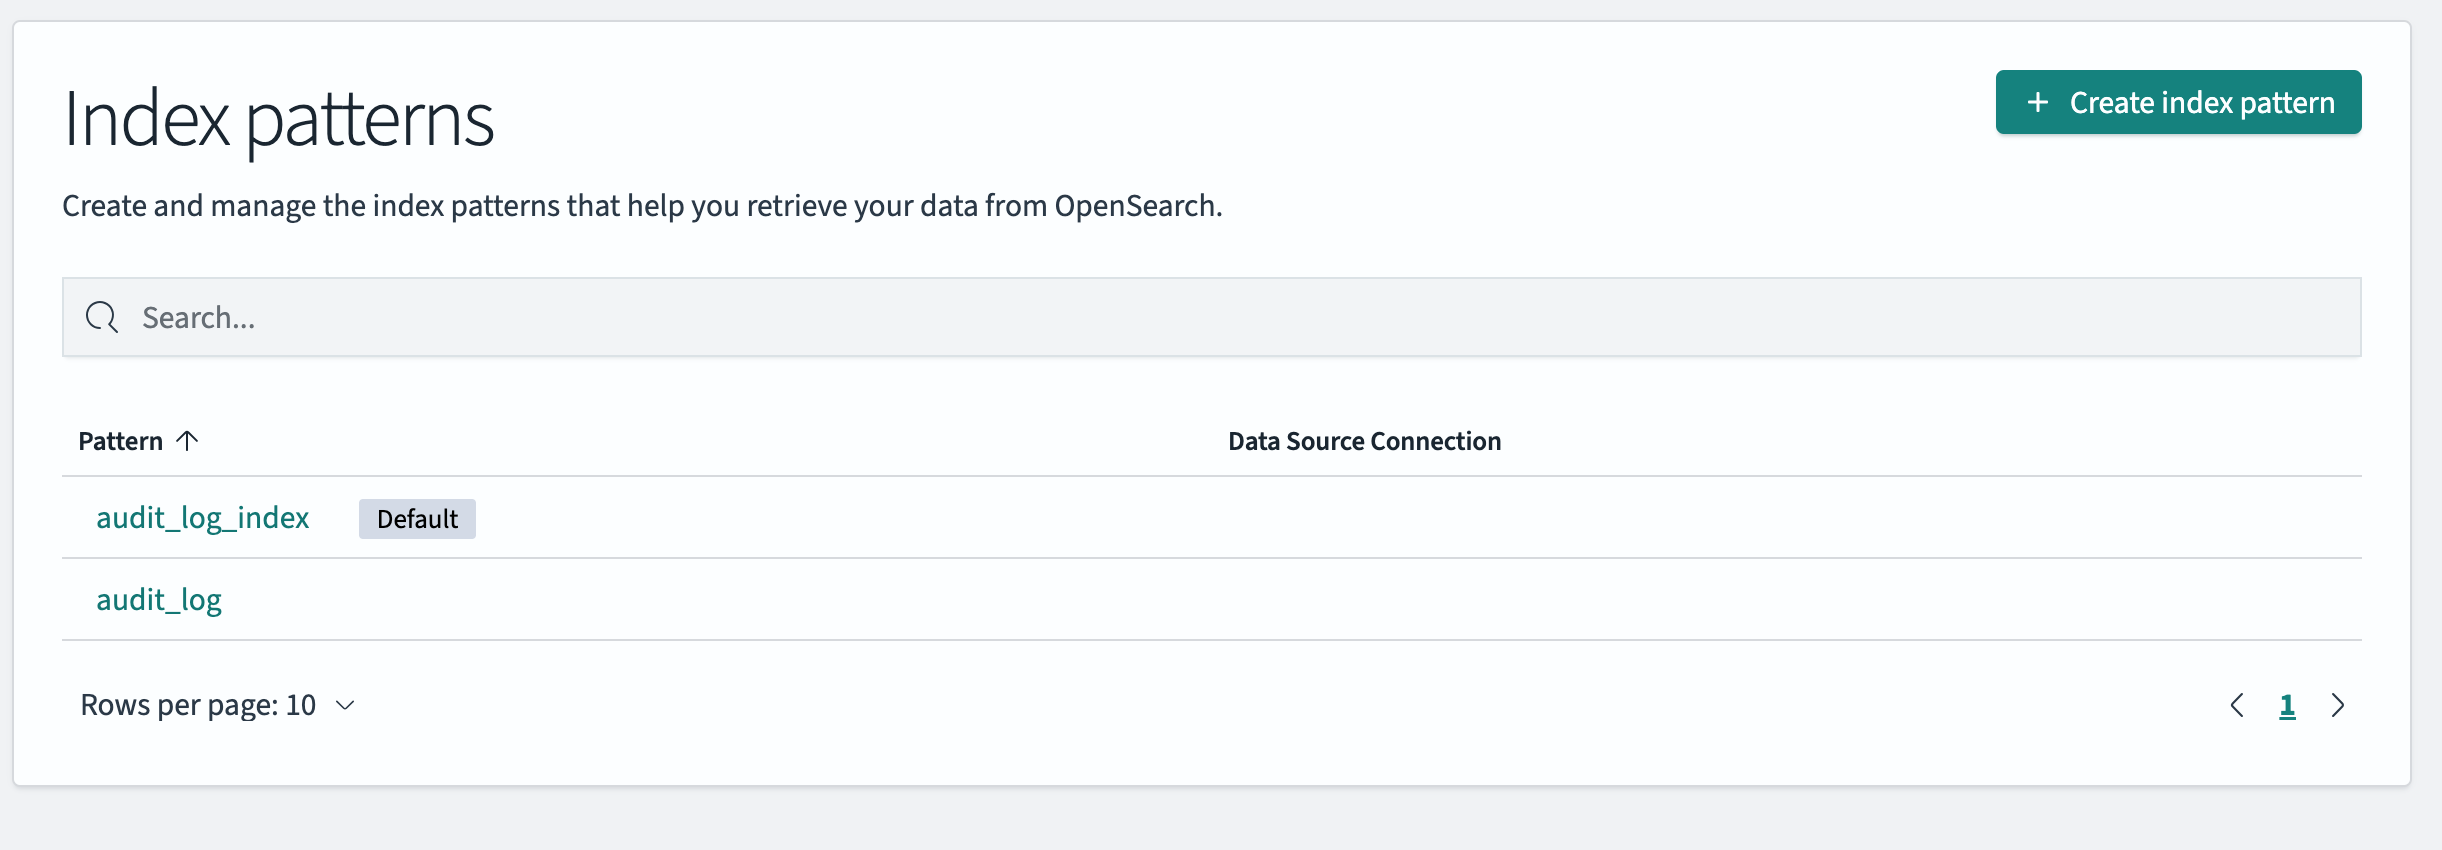
Navigate to Dashboard Management → Index Patterns.
-
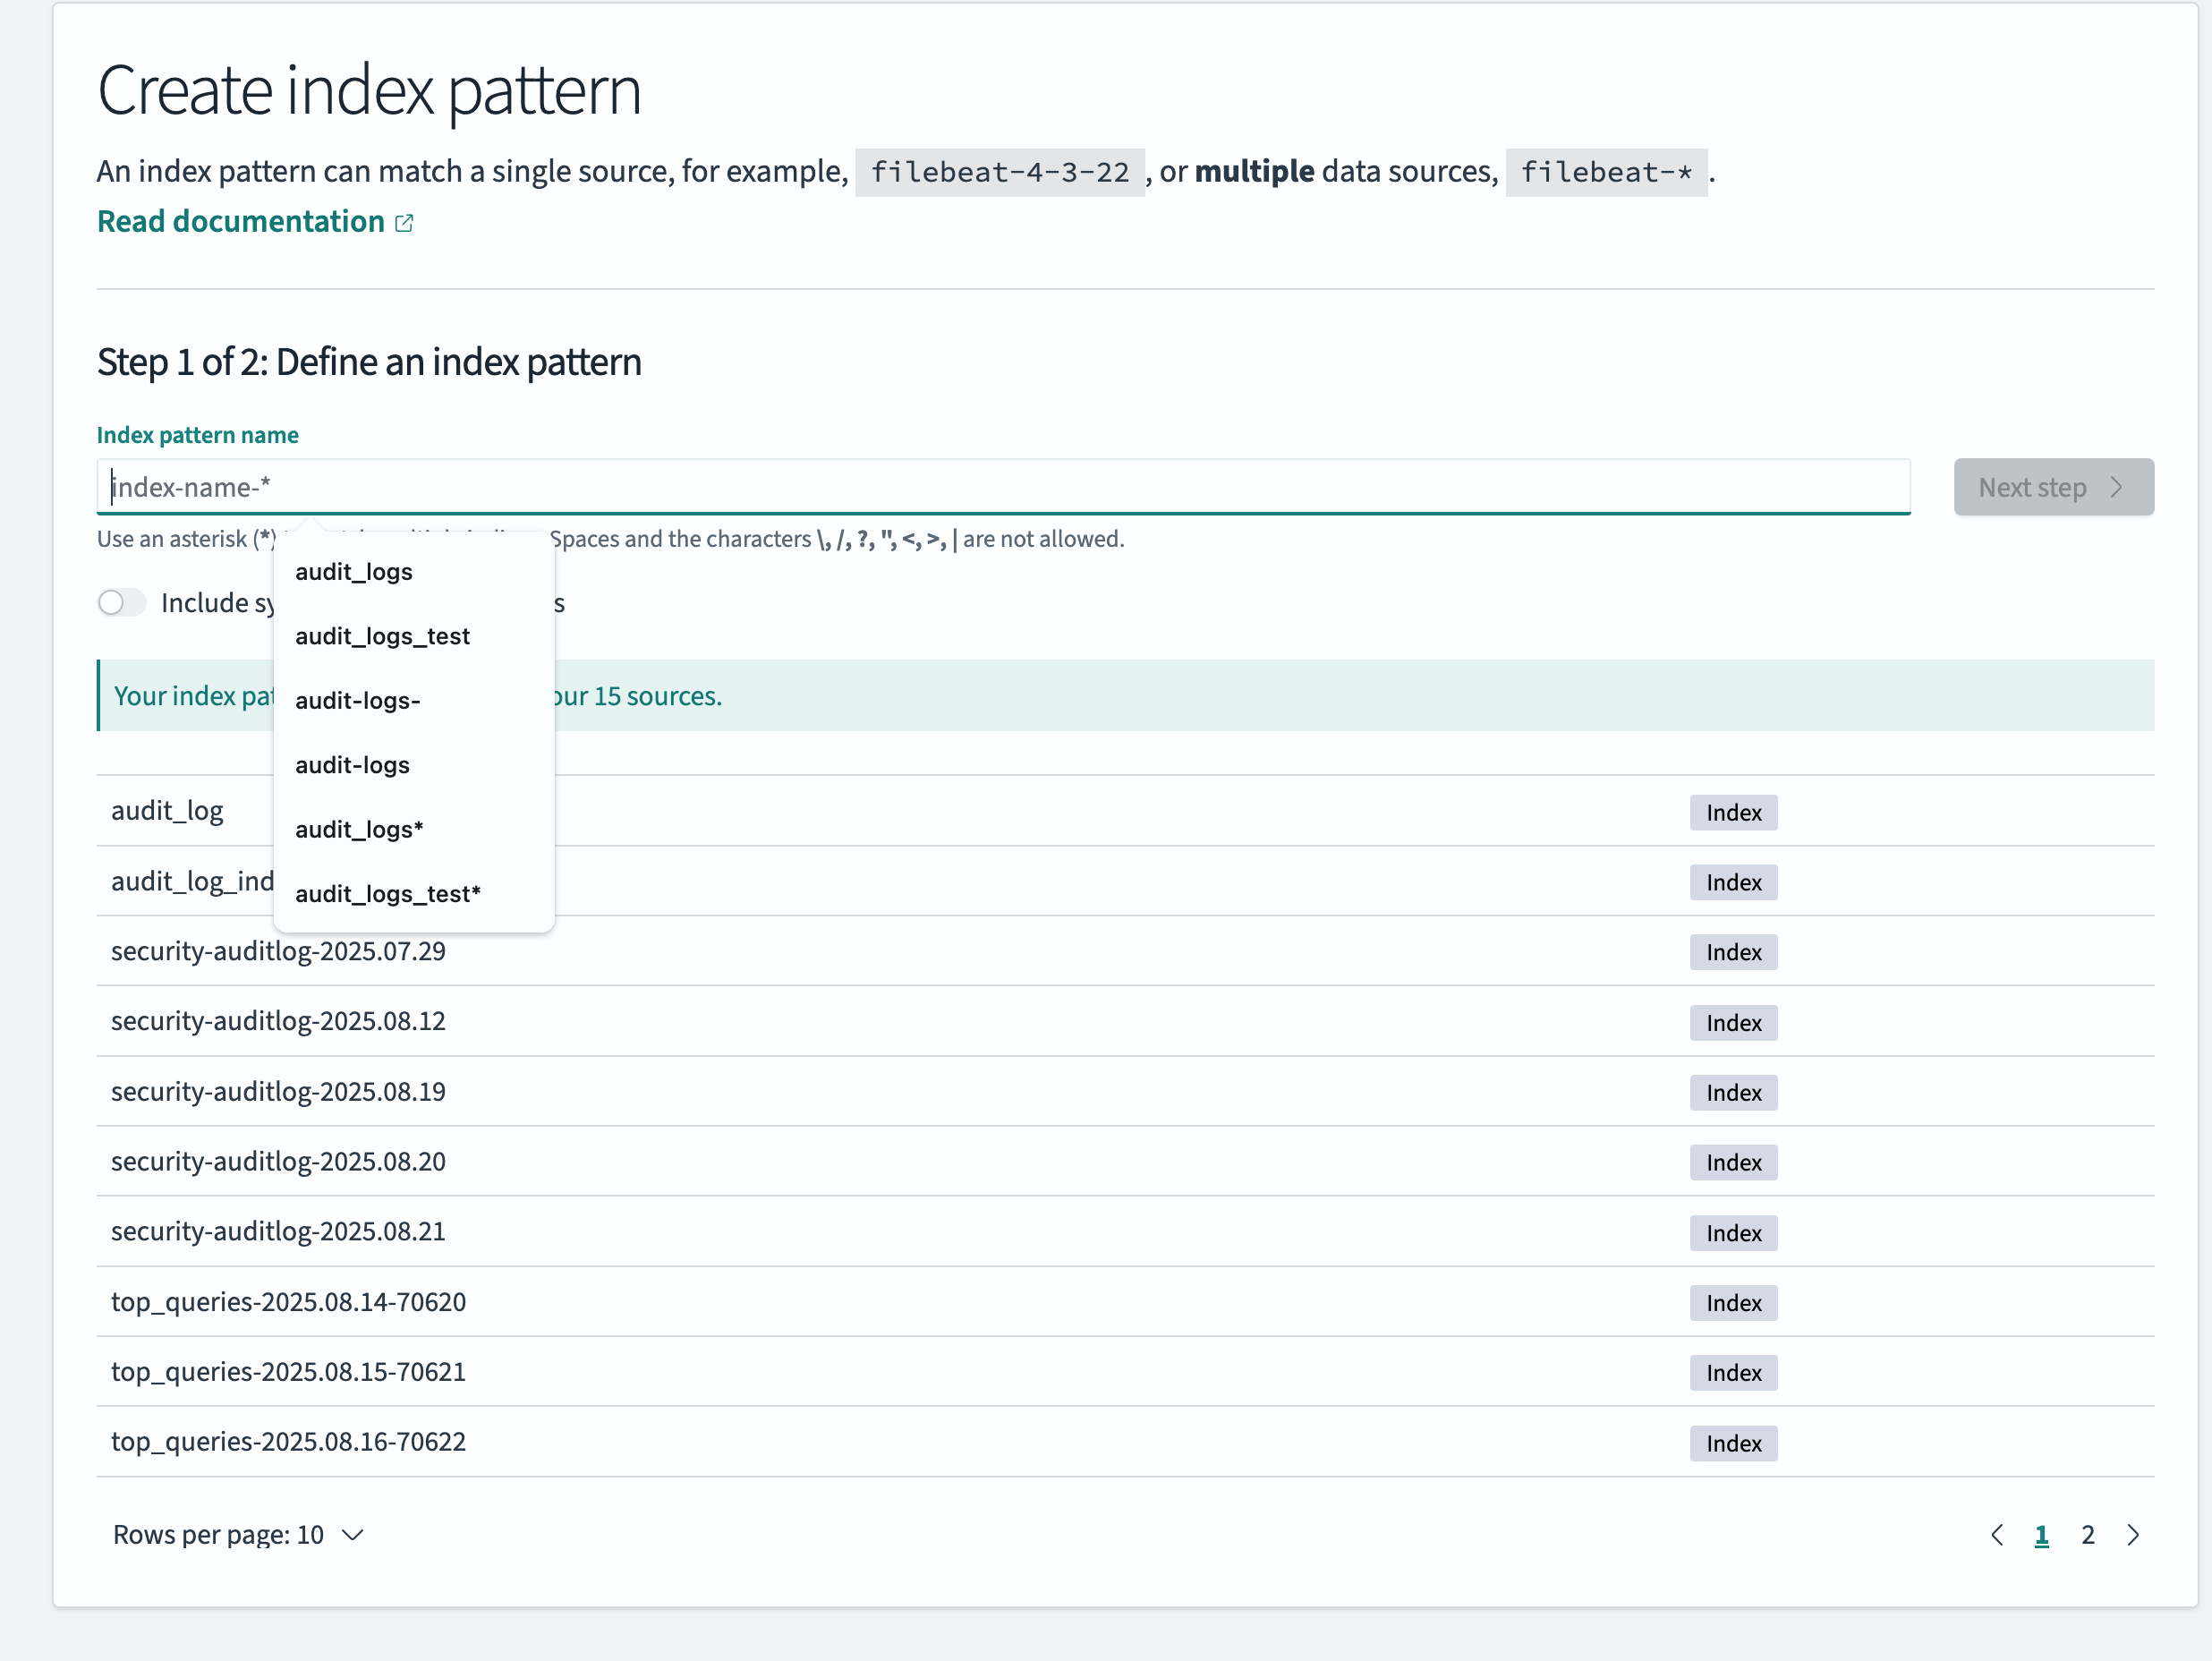
Click Create index pattern.
-
Example:
audit_log_index* -
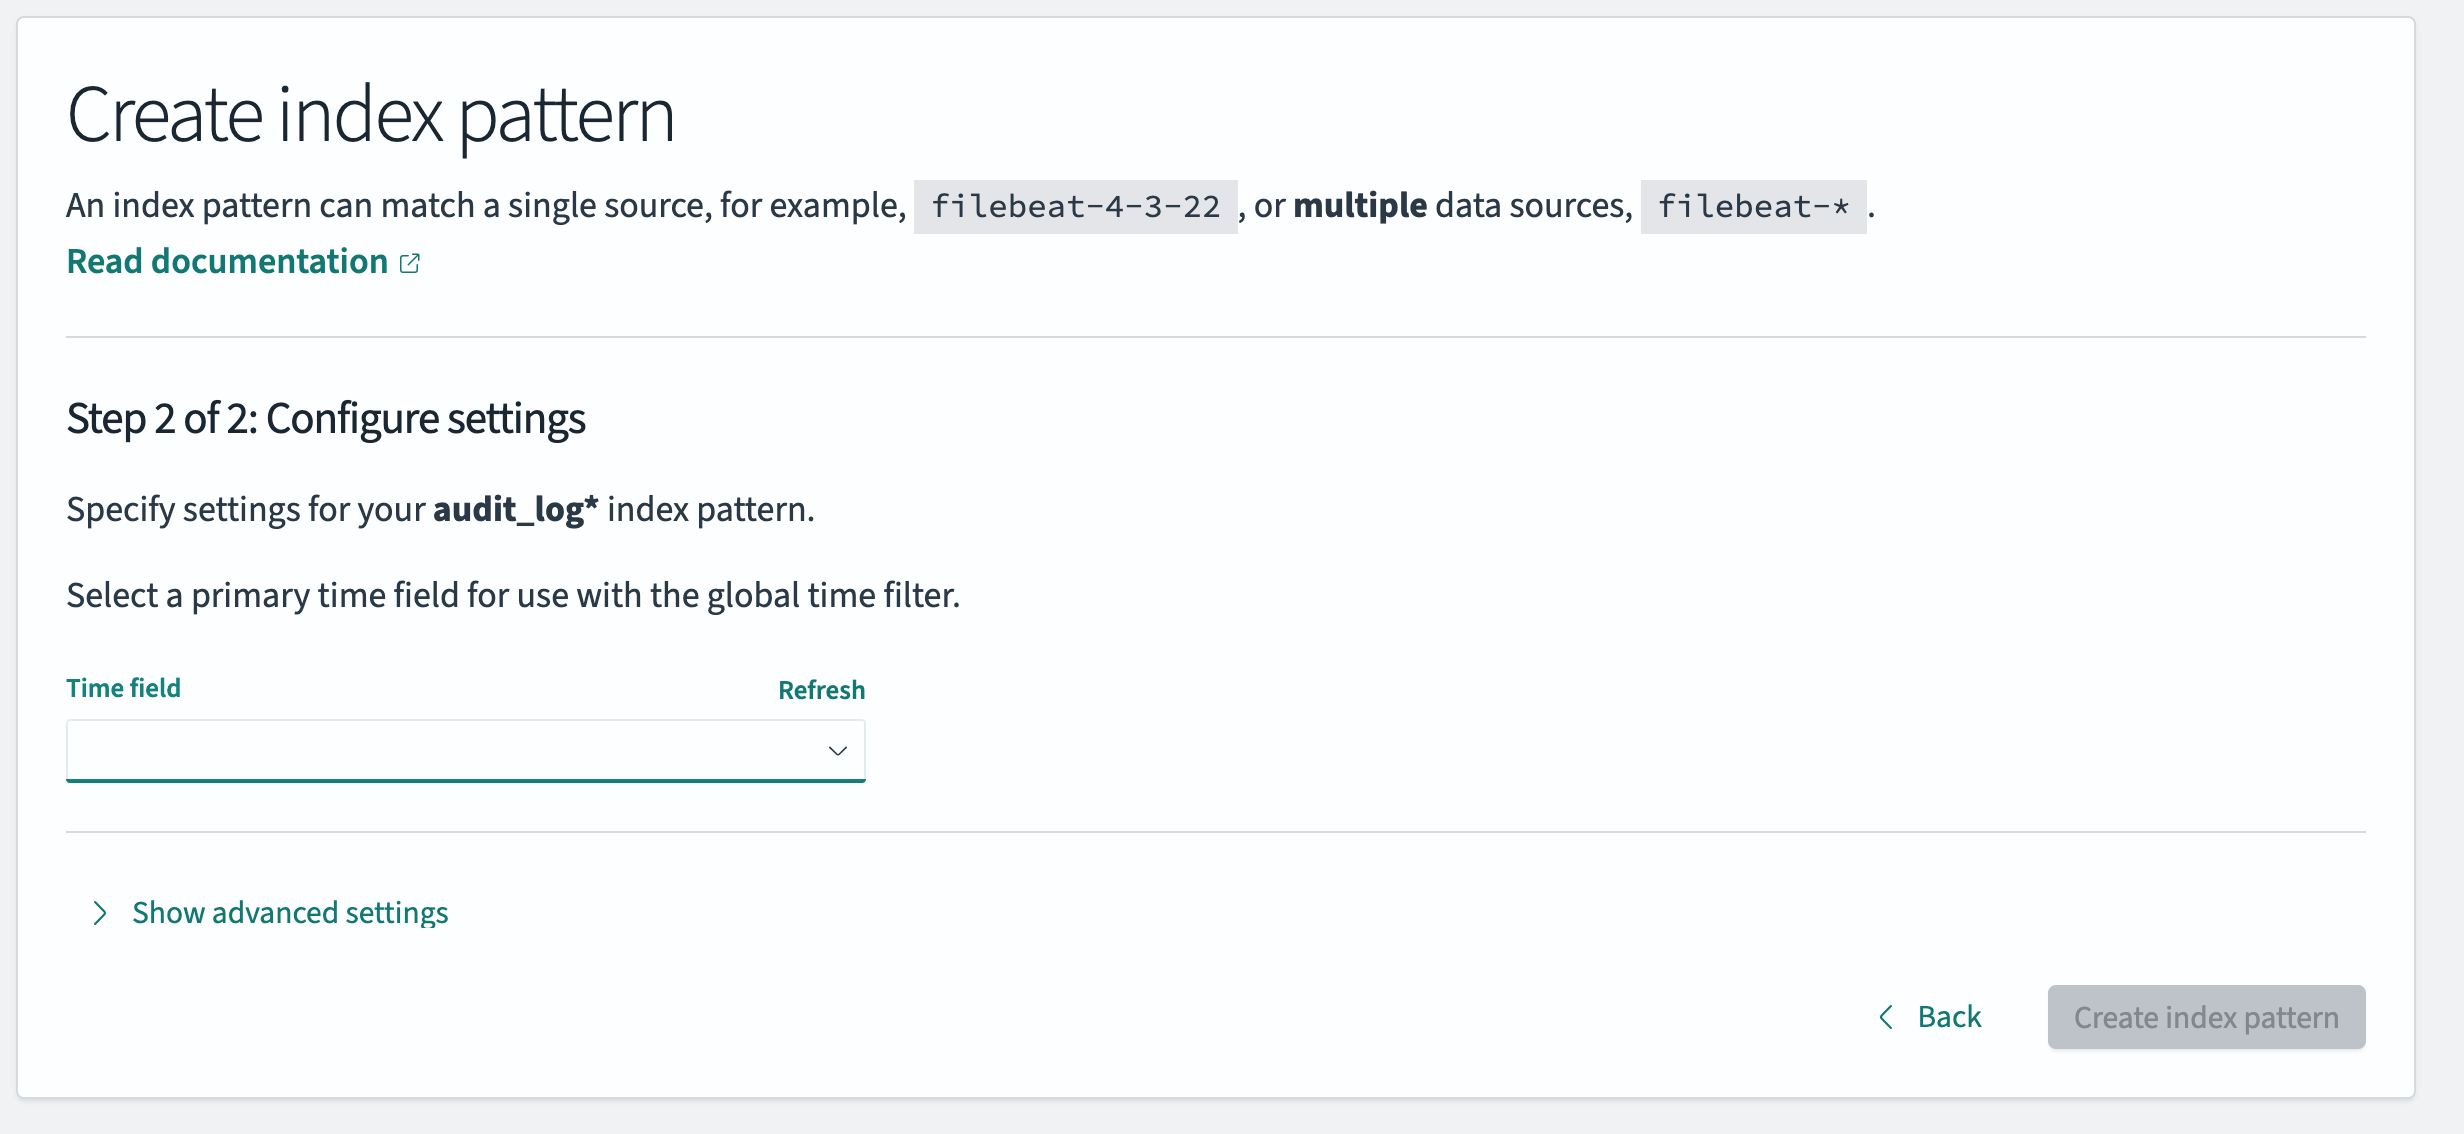
Choose the time field (e.g.,
@timestamp).
-
-
Click on Save.
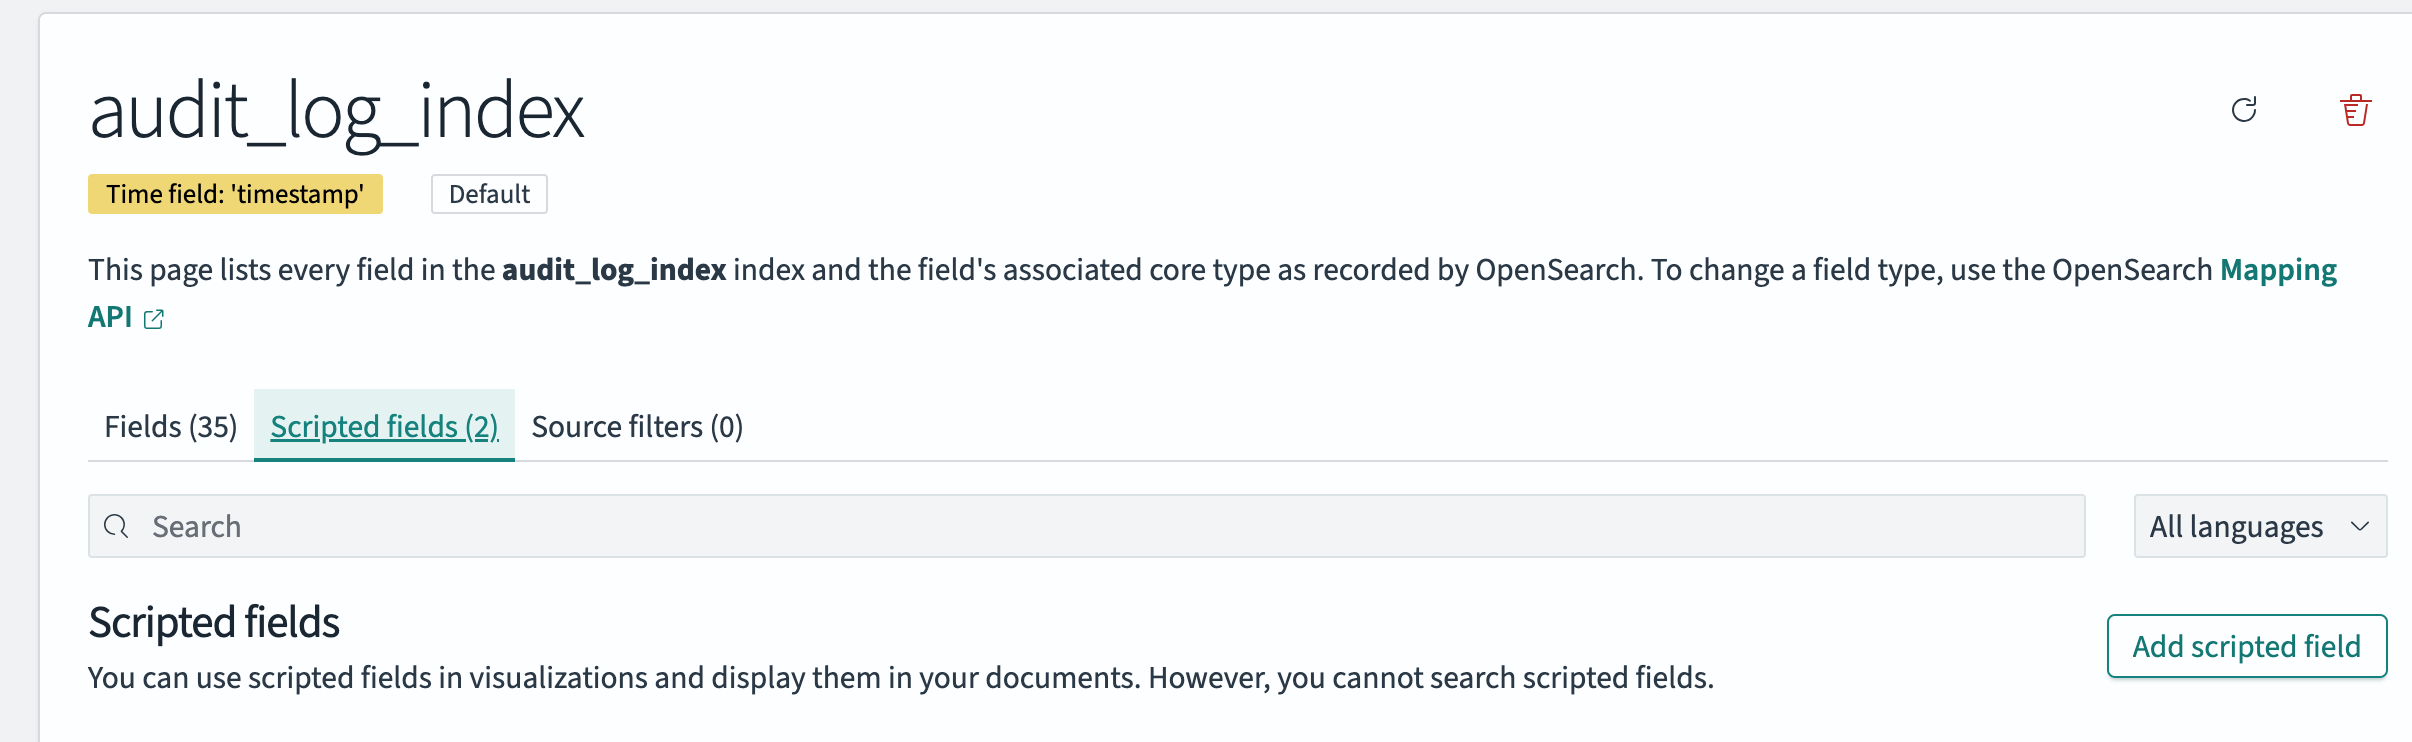
Scripted Fields
Scripted fields enable the transformation of raw log data into human-readable messages at query time. By creating scripted fields in your index pattern, you can display JSON data in a clear and readable format on dashboards.
Steps to create scripted fields
-
In OpenSearch Dashboards, go to:
Dashboard Management → Index Patterns (Data Views). -
Open your index pattern (e.g.,
audit_log_index*). -
Go to Scripted fields → Add scripted field.
-
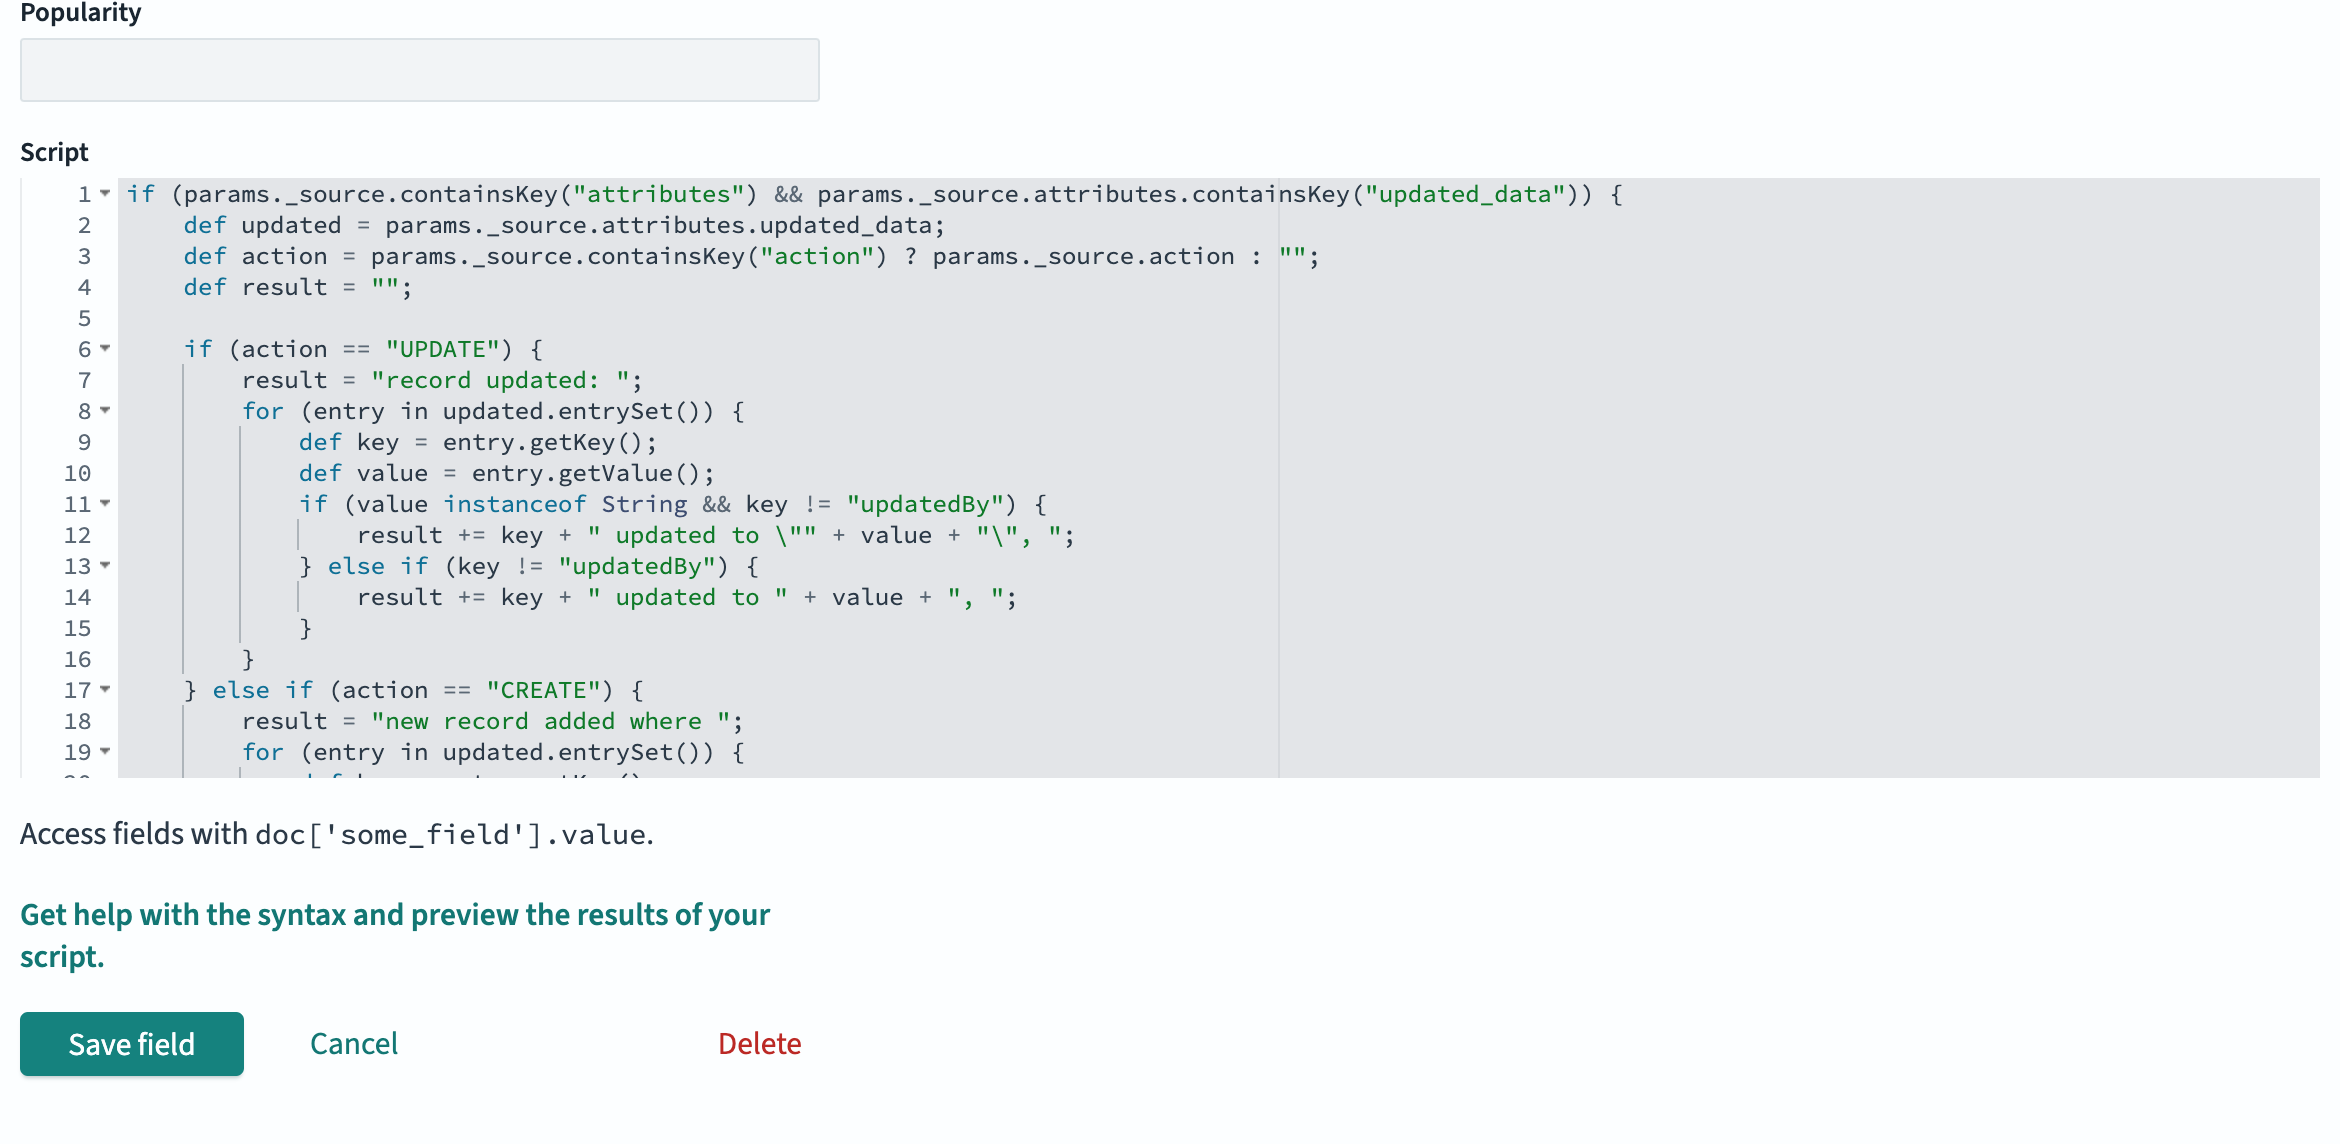
Example: Create a field called
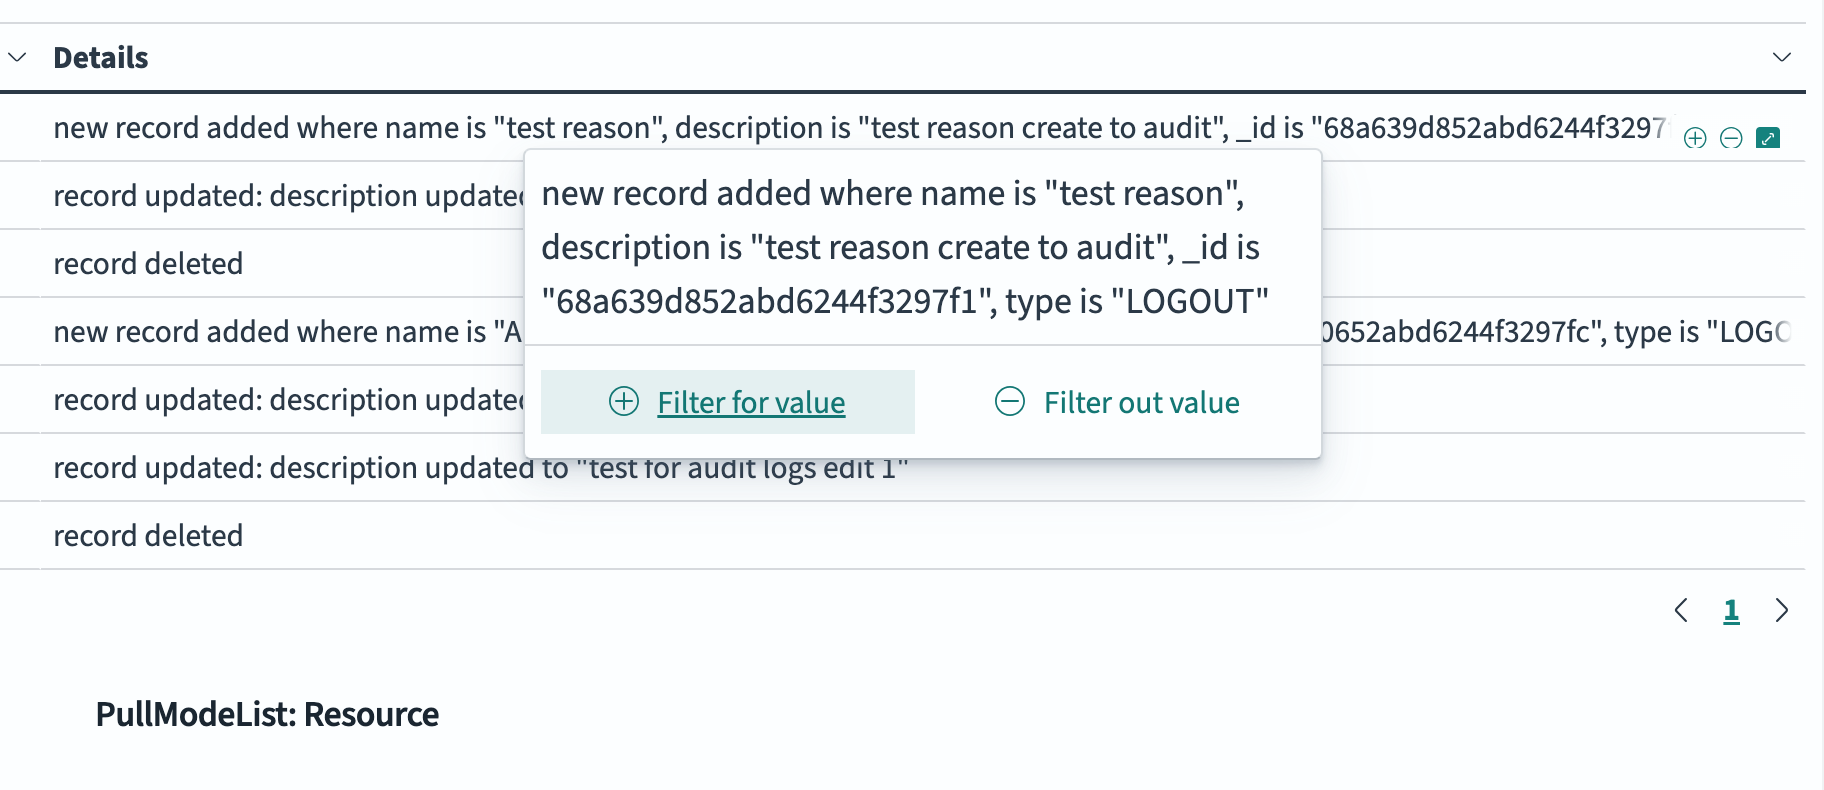
updated_data_jsonand add the following code in the script field:if (params._source.containsKey("attributes") && params._source.attributes.containsKey("updated_data")) { def updated = params._source.attributes.updated_data; def action = params._source.containsKey("action") ? params._source.action : ""; def result = ""; if (action == "UPDATE") { result = "record updated: "; for (entry in updated.entrySet()) { def key = entry.getKey(); def value = entry.getValue(); if (value instanceof String && key != "updatedBy") { result += key + " updated to \"" + value + "\", "; } else if (key != "updatedBy") { result += key + " updated to " + value + ", "; } } } else if (action == "CREATE") { result = "new record added where "; for (entry in updated.entrySet()) { def key = entry.getKey(); def value = entry.getValue(); if (value instanceof String && key != "createdBy") { result += key + " is \"" + value + "\", "; } else if (key != "createdBy") { result += key + " is " + value + ", "; } } } else if (action == "DELETE") { result = "record deleted: record before deletion was "; for (entry in updated.entrySet()) { def key = entry.getKey(); def value = entry.getValue(); if (value instanceof String && key != "updatedBy" && key != "createdBy") { result += key + ": \"" + value + "\", "; } else if (key != "updatedBy" && key != "createdBy") { result += key + ": " + value + ", "; } } } // remove trailing comma + space if (result.length() > 2) { result = result.substring(0, result.length() - 2); } return result; } else { return null; }
We can update the resulting data with required output.
Examples:
If record is deleted, the data field will show: record is deleted
If record is created, the data field will show: new record added where agentSlaDuration is 400, name is "pull mode list", description is "test record created for pull mode list"
If record is updated, the data field will show: record updated: description updated to "test reason edit to audit"
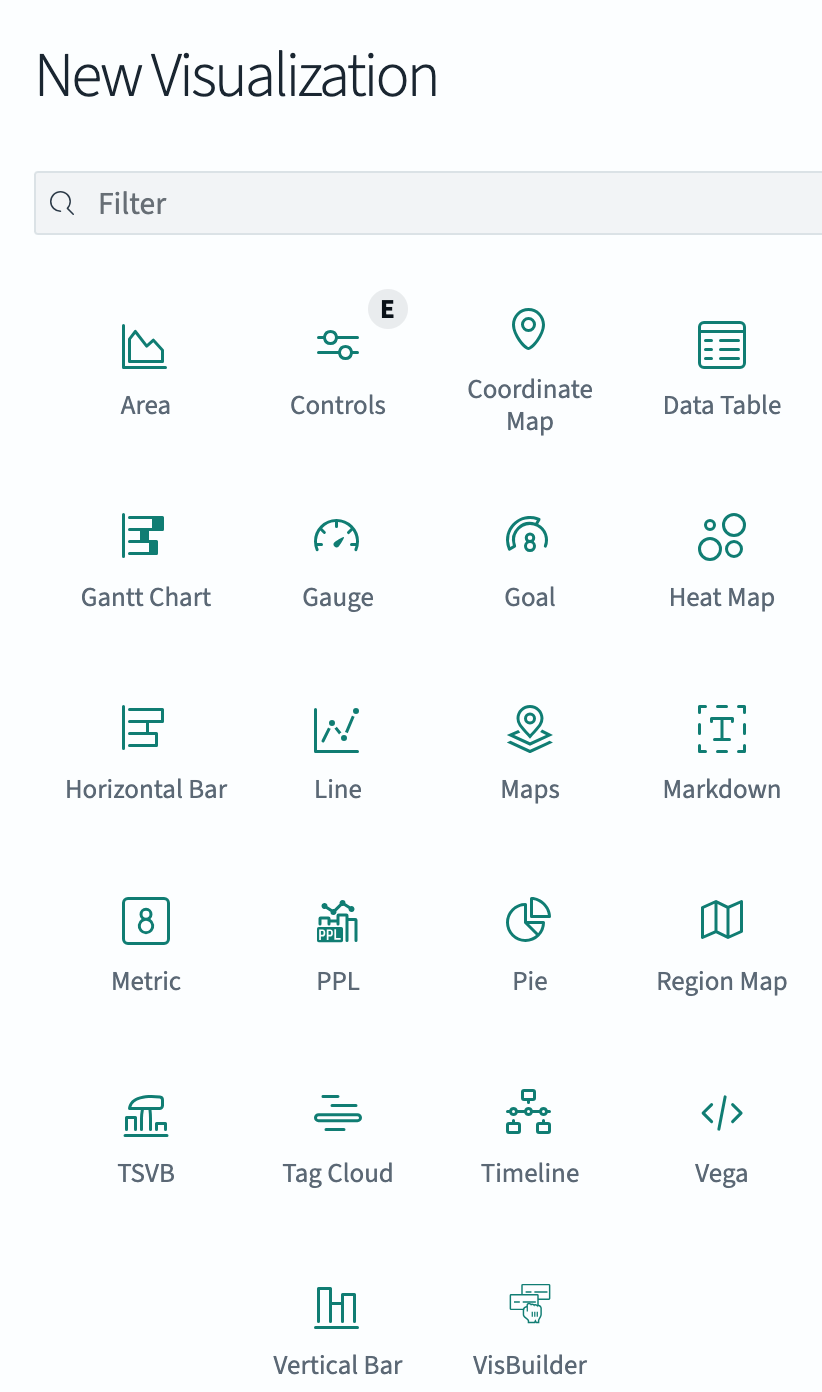
Dashboard Visualizations
-
Go to Dashboards => Create new visualization.
-
Select Data table visualization.
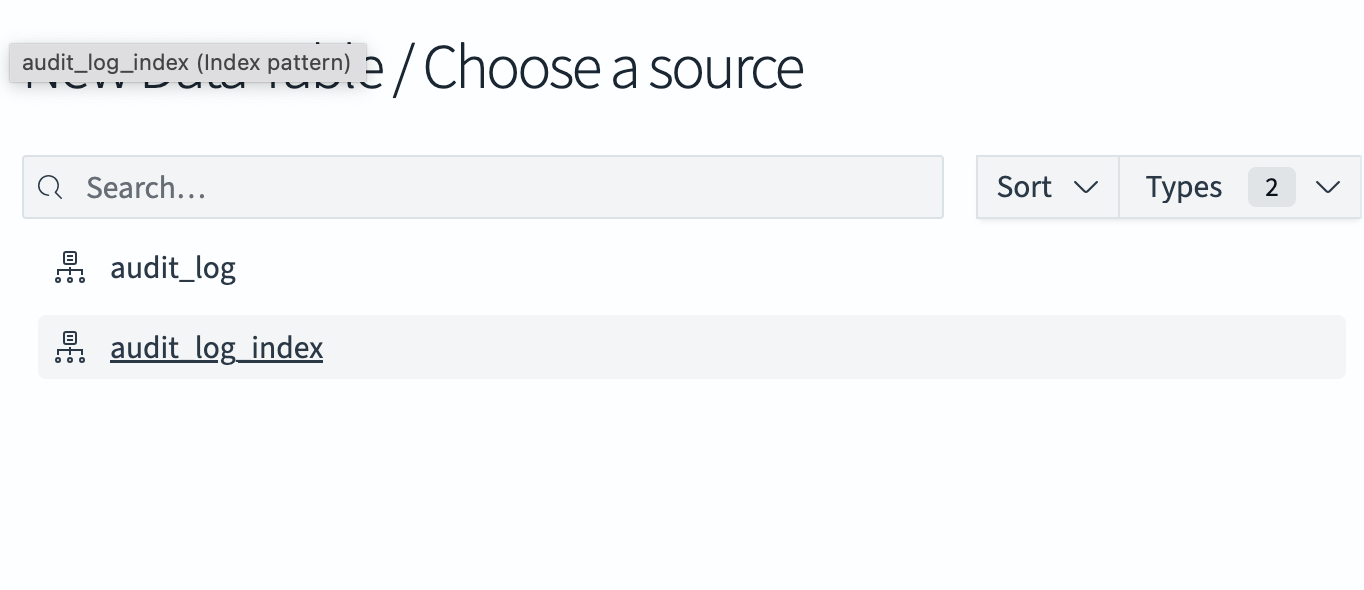
-
Choose the index pattern (audit_log_index) you created in previous step.
-
Click on Save.
-
From the left sidebar you can add the buckets
-
In OpenSearch Dashboards, buckets are how you group and categorize data for visualizations (e.g., by date, by username, by action)
-
In Buckets, use sub aggregation type Term. It groups documents by unique field values.
-
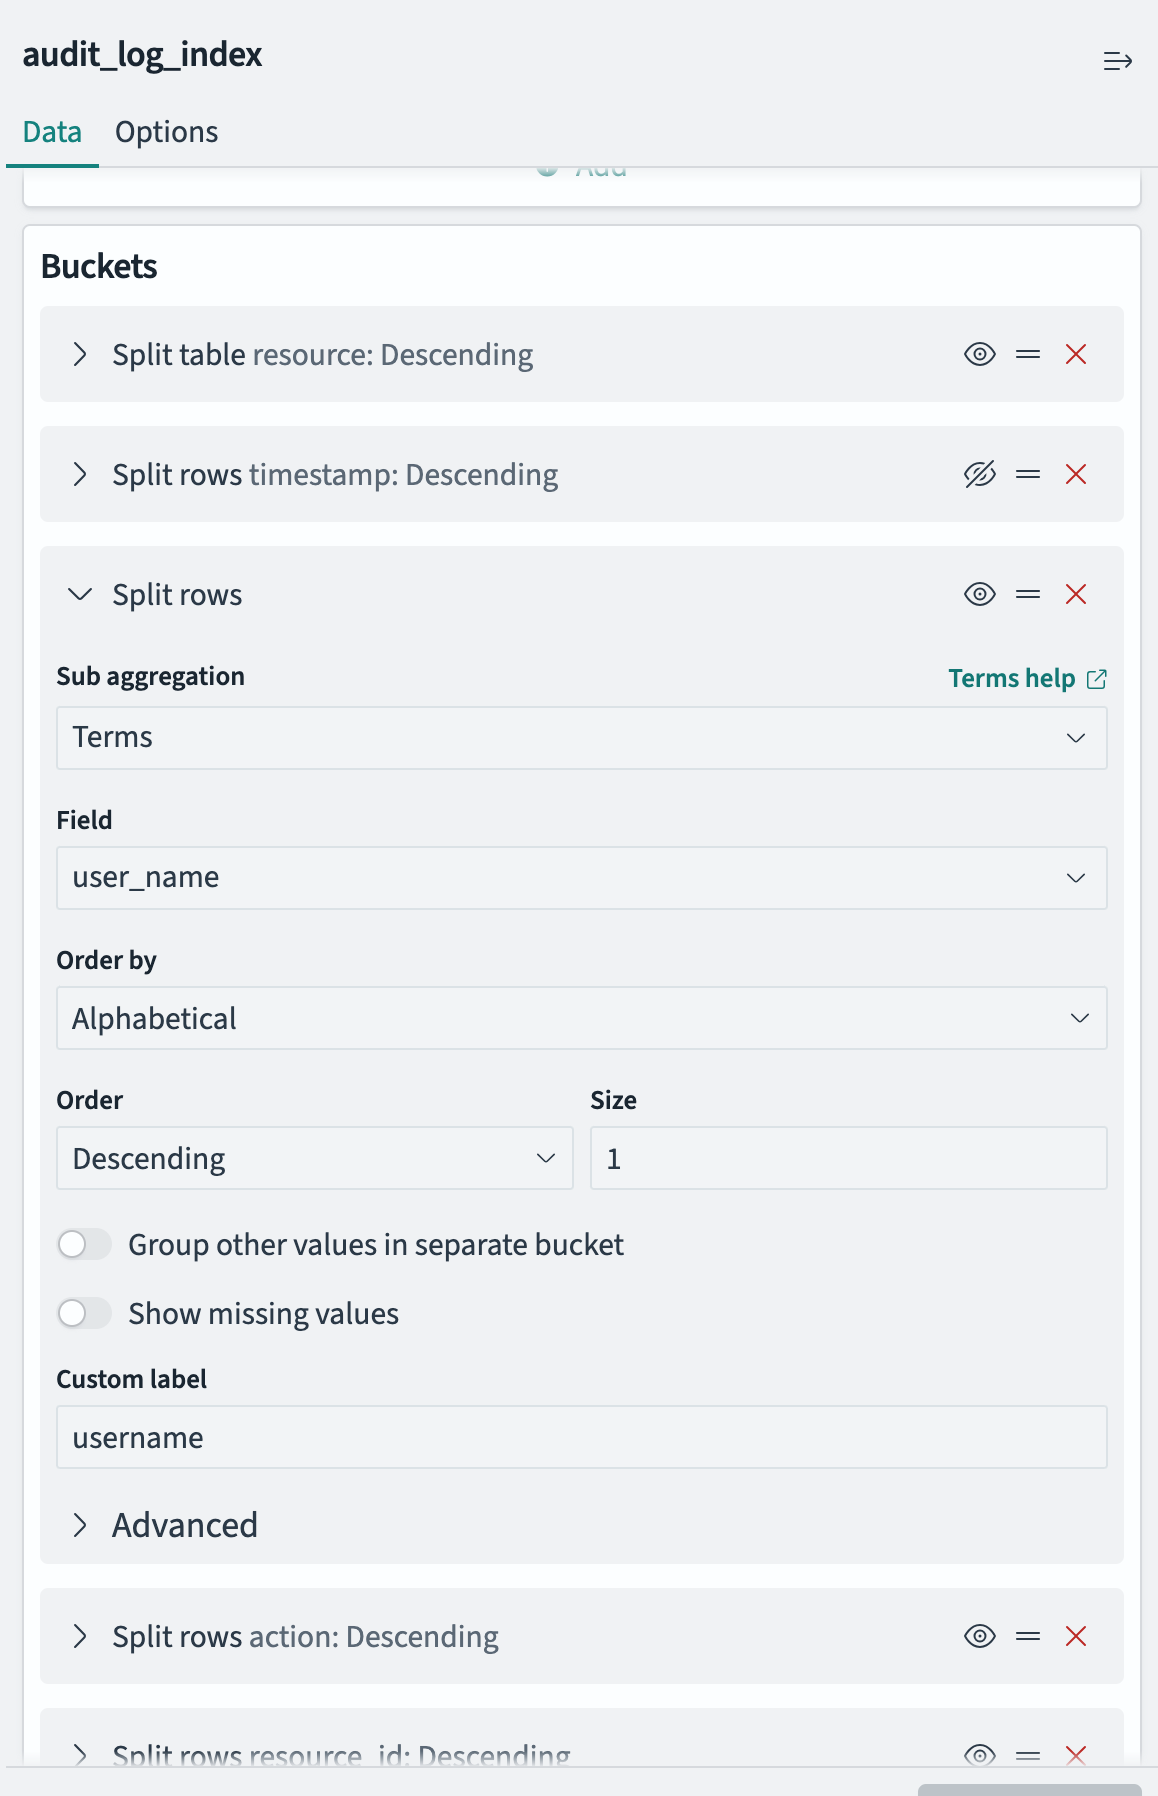
We can use Buckets in two different ways:
-
Split Rows → Adds more rows inside the same table (nested grouping).
-
Split Table → Creates separate tables, one for each bucket value, in below example Resource field uses to split tables.
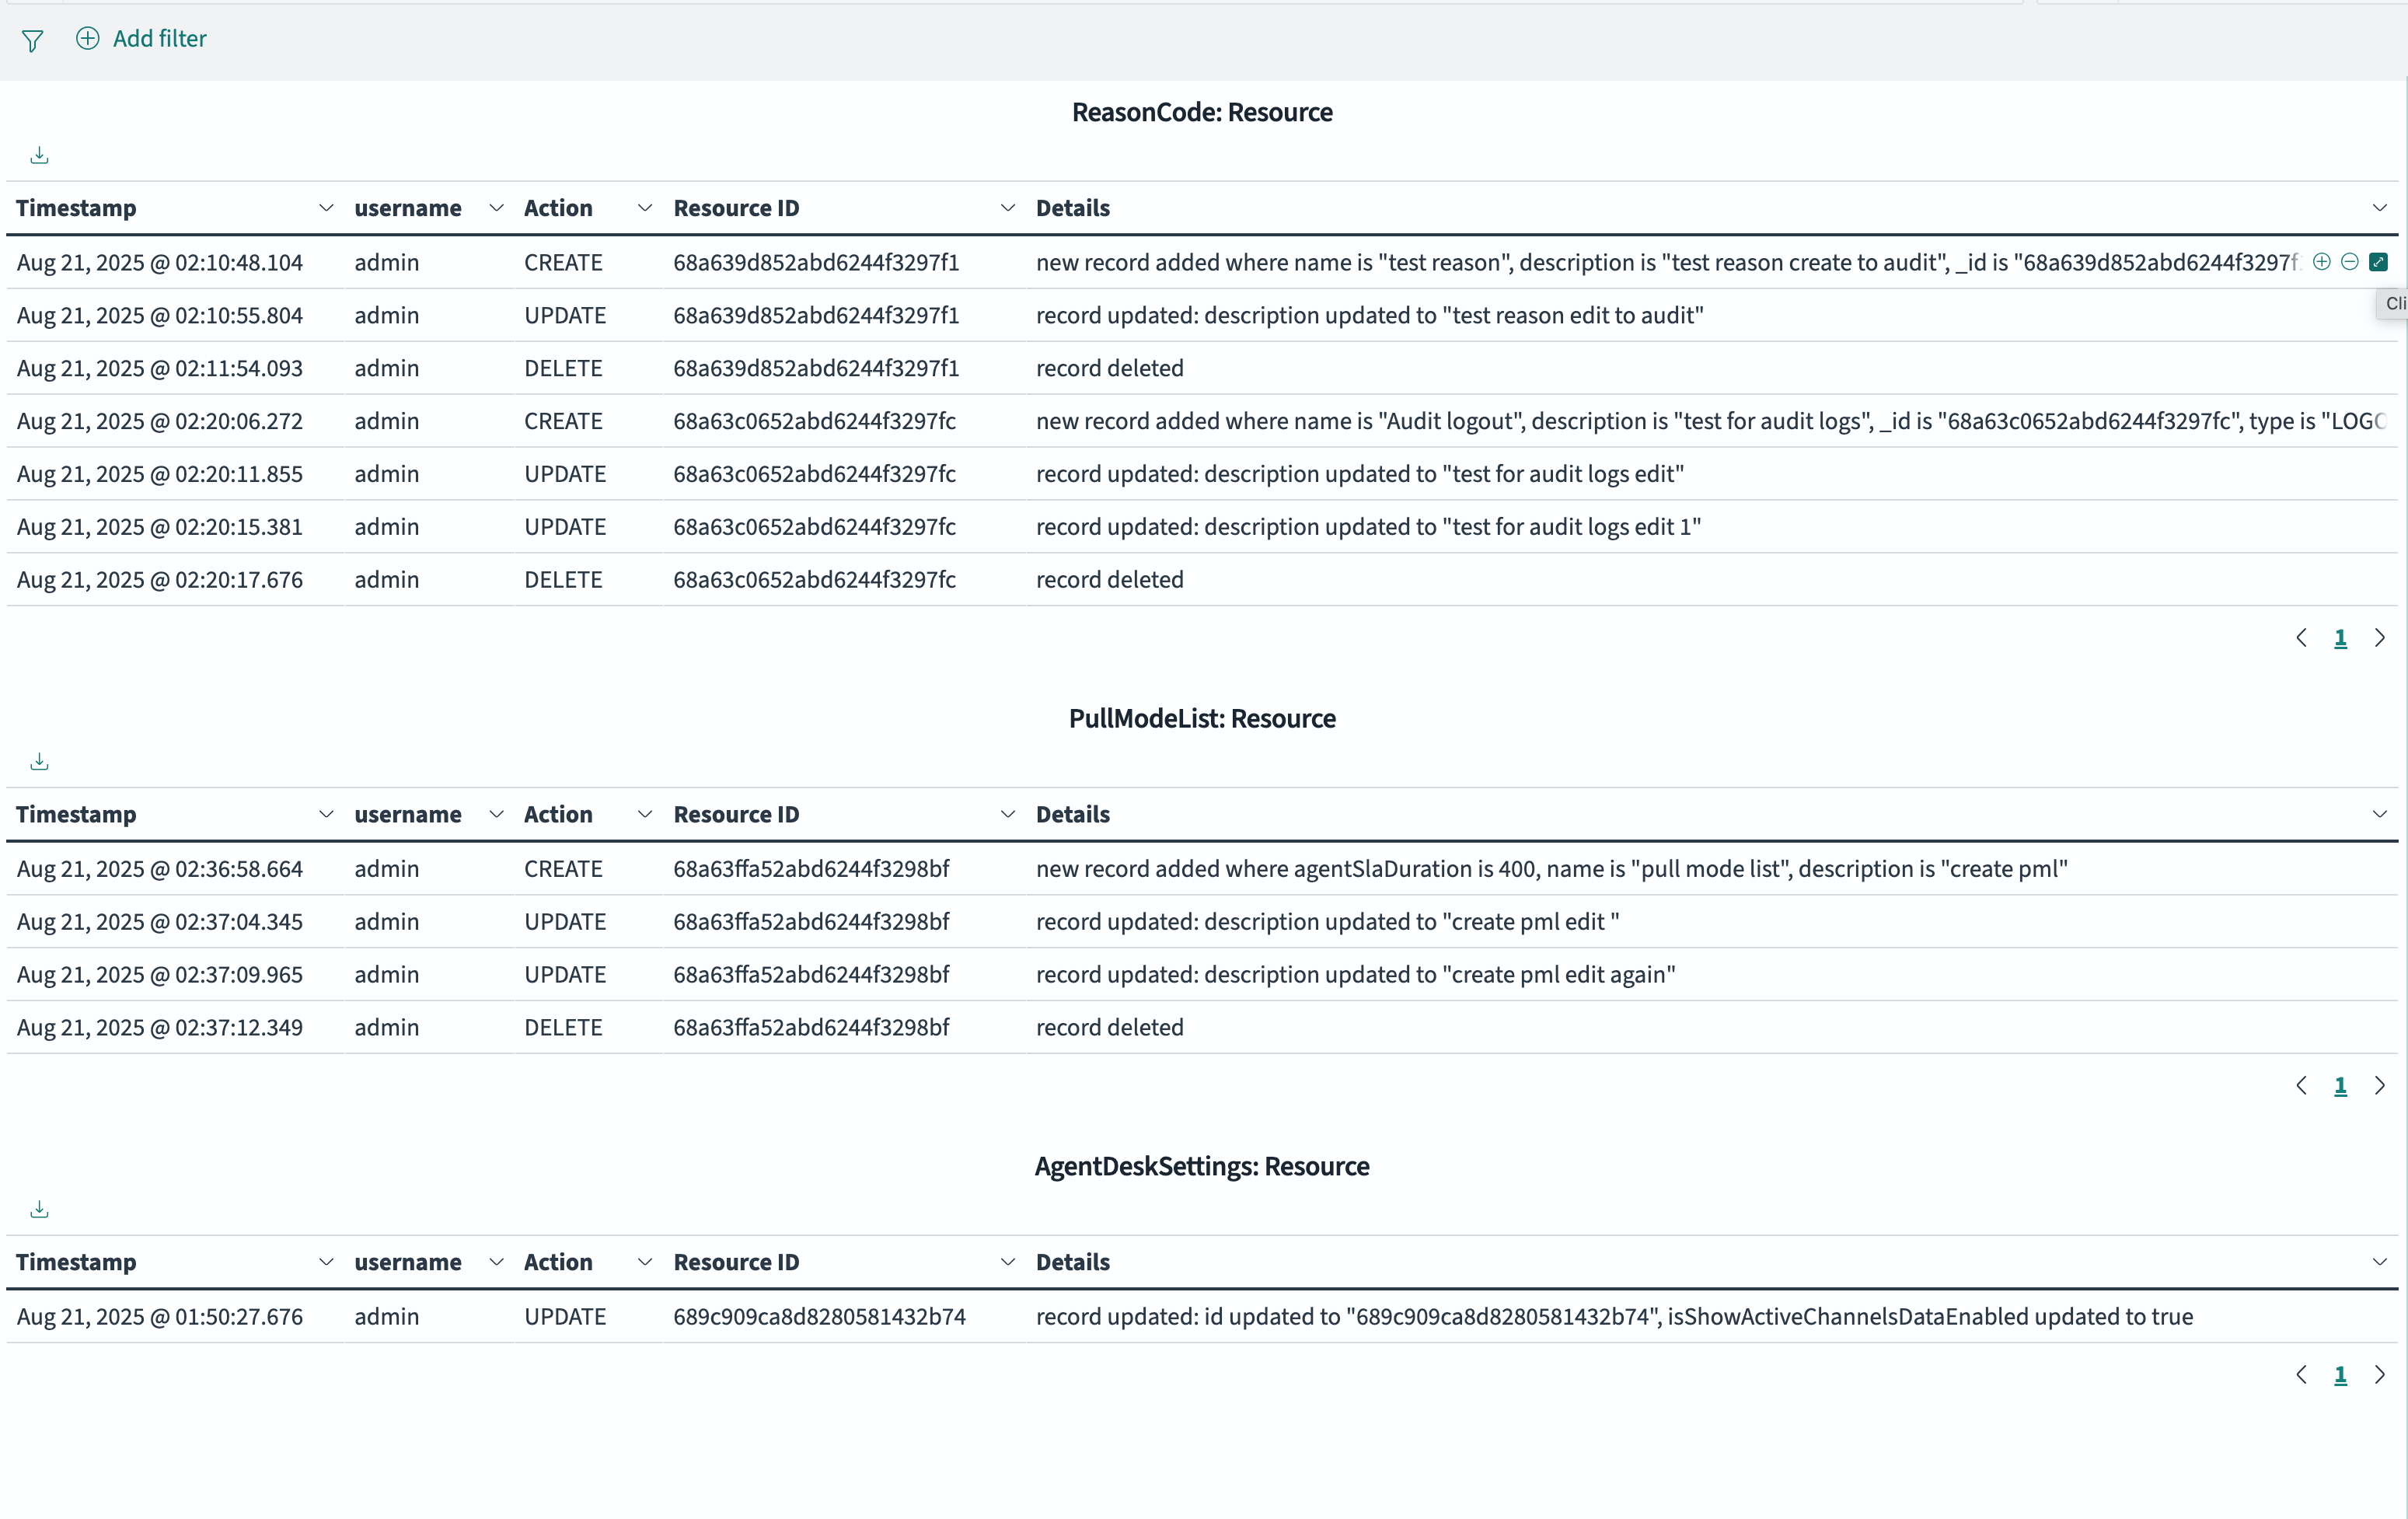
-
You can click on expand button to see the data