
1. Overview
This document describes the PII masking service used to protect credit card numbers and dates of birth in conversations. It summarizes what the service does, how it is packaged and deployed, the runtime controls available to operators, and the current performance and capacity findings.
1.1. Executive Summary
-
The service masks credit card numbers and dates of birth in English and Canadian French conversations.
-
It is stateless. The API returns a masked payload to the calling pipeline, and the pipeline is responsible for storing the result, for example in MongoDB.
-
The runtime uses FastAPI, ONNX Runtime 1.28, CPU-only inference, and INT8 ONNX models.
-
Each pod runs one Uvicorn worker and shares two ONNX inference sessions across requests.
-
Measured memory usage is around
960–985 MiBwhile idle, around1.11–1.14 GiBduring heavy conversation bursts, and around1.4 GiBat startup while models load. -
Production scaling should be horizontal through HPA pods. Adding more workers inside a pod is not recommended because it duplicates model memory.
2. Architecture Diagram
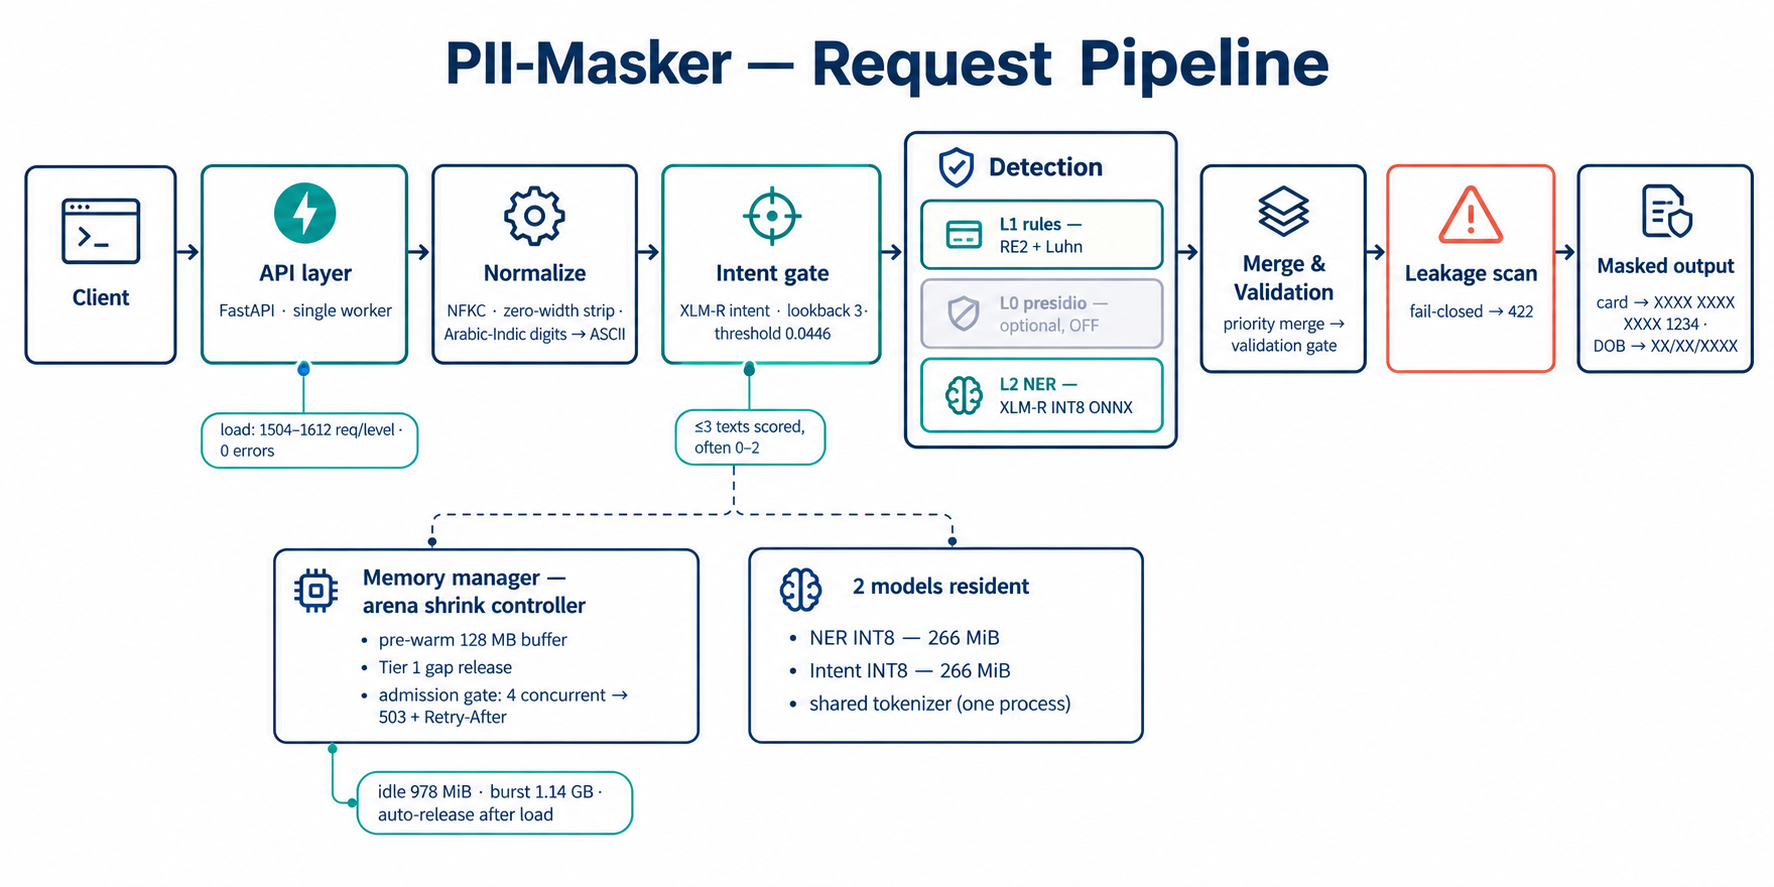
3. Model Architecture and Packaging
The service uses two XLM-R-based models. Both models are packaged as INT8 ONNX files and loaded in the same process.
|
Model |
Purpose |
Base architecture |
Runtime package |
|---|---|---|---|
|
NER model |
Detects credit card and date-of-birth spans at token level. |
XLM-R base |
INT8 ONNX, 266 MiB. The FP32 version is 1.03 GiB with external data and is not shipped in the image. |
|
DOB intent model |
Detects whether an agent or bot asked for a date of birth. |
XLM-R base |
INT8 ONNX, 266 MiB. |
3.1 NER behavior
The NER model identifies credit card and date-of-birth entities in normal text, spoken-digit formats, word-split formats, and partially masked formats. It uses 11 BIO labels: O, B/I-CREDIT_CARD, B/I-DOB, B/I-DOB_DAY, B/I-DOB_MONTH, and B/I-DOB_YEAR.
3.2 Date-of-birth intent gate
The DOB intent model emits P(DOB_REQUEST) with a recall-biased threshold of 0.0446. A bare date in a customer message is masked as a DOB only when one of these conditions is true:
-
The same customer message contains DOB context such as “born” or “date de naissance”.
-
One of the previous three agent or bot messages asked for a DOB.
Strict rules are applied first. The intent model is used for ambiguous cases. This keeps ordinary dates, such as appointments and statement dates, from being masked incorrectly. The intent model runs only for POST /mask/conversation, and only when a customer message looks date-like.
3.3 Quantization and validation
Models are dynamically quantized to INT8 with scripts/optimize_onnx.py. Packaging is allowed only after FP32-to-INT8 parity and false-negative audits pass. The relevant artifacts are artifacts/parity_fp32_int8.json and artifacts/fn_audit_int8.json.
At startup, the loader automatically prefers model.int8.onnx and verifies checksums.sha256.
3.4 Shared tokenizer
Both models share one 250,002-token XLM-R tokenizer. The tokenizer is loaded once and protected by a lock, saving roughly 280–296 MiB of RAM.
4. Runtime Resource Management
4.1 Process model
Each pod runs one uvicorn worker with WEB_CONCURRENCY=1. The process owns two ONNX InferenceSession instances: one for NER and one for DOB intent. These sessions are shared by all requests.
Running extra workers inside the same pod is not recommended because it would duplicate model memory and break cross-request batching.
4.2 Dynamic batching
Requests are collected for up to 8 ms and processed in batches of up to 16 sequences per inference. ONNX_THREADS controls the NER session’s intra-op threads and should match the pod CPU limit. The intent session uses ONNX_INTENT_THREADS, which defaults to 1.
4.3 Memory optimization
The main memory optimizations are:
-
Shared tokenizer, saving approximately 285 MiB.
-
Lazy loading of Presidio and spaCy, saving approximately 86–173 MiB while Layer 0 remains disabled.
-
A 128 MiB arena pre-warm at startup so the first requests do not pay allocation latency.
4.4 Arena shrink controller
A background controller runs every 60 seconds. It measures held-but-unused ONNX Runtime arena memory and releases memory above the configured buffer. Validation measured live releases of 148–294 MiB. With the 60-second production interval, release can happen up to about 60 seconds after the burst ends.
Set PII_ARENA_ENABLED=false to disable the controller.
4.5 Admission control
POST /mask/conversation allows up to four concurrent requests inside the ML pipeline. Extra requests receive an immediate 503 response with Retry-After: 2. This protects the event loop and prevents 504 storms.
POST /mask does not use this admission gate.
4.6 Parallel chunking option
PII_MODEL_ONNX_MAX_PARALLEL_CHUNKS defaults to 1 for the lowest memory footprint. Setting it to 2 can reduce large flushes by about 1.3–2 seconds, but only when ONNX_THREADS is below the pod CPU count. The trade-off is an additional 150–185 MiB peak RSS.
Detailed design notes are available in reports/RAM_OPTIMIZATION_PLAN.md, sections 3–5.
5. Load Test Results
The following results were recorded on 2026-09-30 on an 8-core VM with ONNX_THREADS=2 and INT8 models. The per-run rows were recorded during the session. The concurrency ladder is artifact-backed. Memory stayed flat under light, medium, and heavy request patterns.
|
Scenario |
Requests |
Errors |
p50 / p95 latency |
RSS behavior |
|---|---|---|---|---|
|
Light load: 1 concurrent × 60 s |
1,504 |
0 |
49 / 71 ms |
Flat at 962 MiB |
|
Medium load: 5 concurrent × 60 s |
1,539 |
0 |
213 / 341 ms |
Flat at 963 MiB |
|
Heavy load: 16 concurrent × 60 s |
1,612 |
0 |
654 / 1,015 ms |
Flat at 963 MiB |
|
Conversation batch-16, serial |
3 |
0 |
About 3.5–11 s depending on co-load |
963 → 1,114 MiB, then reduced by 148 MiB through arena shrink |
5.1 Throughput
For small texts that contain card or DOB cues, the service handles about 20–26 requests per second per pod with ONNX_THREADS=2. With ONNX_THREADS=4 on 4 CPUs, throughput is about 31 requests per second.
The service is CPU-bound, so production scaling should use HPA pods instead of additional in-process workers.
5.2 Concurrency hardening
The post-hardening concurrency ladder was stable:
-
c=2: 2 successful responses. -
c=4: 4 successful responses. -
c=8: 4 successful responses and 4 graceful503rejections.
No 504 responses were observed.
6. Accuracy and Validation
Accuracy was recorded during the 2026-09-30 session using the same script, dataset, and machine state before and after the optimization changes. This makes the A/B comparison valid for confirming that runtime optimizations did not change model output.
These are NER model Layer 2 metrics only. scripts/evaluate_runtime_onnx.py scores the ONNX NER model with seqeval. End-to-end masking also uses deterministic rules, the validation gate, and the leakage scan, so these figures should not be treated as the final masking accuracy of the complete service.
The evaluation used the published splits: 10,000 test rows and 5,000 adversarial rows, both capped at 5,000 rows by the evaluation limit.
|
Split |
Precision |
Recall |
F1 |
|---|---|---|---|
|
Test |
0.761 |
0.676 |
0.716 |
|
Adversarial |
0.917 |
0.832 |
0.872 |
6.1 Entity-level highlights
-
CREDIT_CARD achieved adversarial F1 of 0.963 with recall of 0.9996.
-
DOB component F1 ranged from 0.647 to 0.845.
6.2 Optimization impact
Pre-change and post-change code produced 42 out of 42 identical metrics, with Δ = 0.000000. The memory and runtime optimizations did not affect accuracy.
6.3 Context
Release-gate thresholds of 0.995 in scripts/check_release_gates.py apply to a separate gold calibration set. The older stored artifact, runtime_eval_results.json from 2026-08-17 with 2,000 rows, is a stale baseline and should not be compared directly with this session.
7. Operational Configuration
All runtime controls are configuration-only and are delivered through environment variables or the Helm ConfigMap. The defaults below are the Helm chart values unless noted otherwise.
|
Configuration key |
Default |
Purpose |
|---|---|---|
|
|
|
Uvicorn worker count. Keep this at 1. |
|
|
|
NER intra-op threads. Set this equal to the pod CPU limit. |
|
|
|
Intent model intra-op threads. |
|
|
|
Uses the ONNX Runtime inference path. |
|
|
|
Dynamic-batch gather window. |
|
|
|
Maximum wait per NER inference before a 504. |
|
|
|
Maximum wait per intent inference before a 504. |
|
|
|
Chunks per flush. Use 2 only when |
|
|
|
Admission gate limit for |
|
|
|
DOB gate mode: |
|
|
|
Enables the arena shrink controller. |
|
|
|
How often the shrink check runs. |
|
|
|
Retained post-shrink buffer and pre-warm target. |
|
|
|
Optional Presidio Layer 0 card detection. Enabling it loads spaCy and adds about 86–173 MiB. |
8. Resource Requirements
The measurements below were taken on an 8-core VM. The server was pinned to 4 cores with taskset to mimic a 4-CPU pod. The run used production defaults: ONNX_THREADS=4, WEB_CONCURRENCY=1, INT8 models, and the arena controller enabled.
Each step ran for 15–20 seconds, with about two minutes of total load. Treat these figures as indicative. CPU is process CPU time divided by wall time, where 1.0 means one full core. RSS was sampled from /proc every 0.5 seconds.
8.1 RAM
RAM does not grow with request rate. It is driven mainly by batch size, message length, and whether parallel chunking is enabled.
|
State |
RSS |
|---|---|
|
Startup peak during model load and checksum verification |
About 1,428 MiB, or 1.4 GiB |
|
Idle floor plus pre-warmed buffer |
961–983 MiB |
|
|
961–992 MiB, flat |
|
|
Up to about 1,015 MiB |
|
Heavy batch-16 conversation burst from 2026-09-30 |
About 1,114 MiB, then released by arena shrink |
|
Worst case under continuous heavy load, design bound |
Floor + 392 MiB, about 1.35 GiB |
|
|
Additional 150–185 MiB |
8.2 CPU for POST /mask/conversation
This test used the 40-message conversation fixture from scripts/loadtest_concurrent.py.
|
Traffic |
CPU used, cores |
p50 / p95 latency |
|---|---|---|
|
0.5 conversations/s |
0.69 |
716 / 762 ms |
|
1 at a time, serial, about 1.4 conv/s |
1.83 |
698 / 799 ms |
|
4 concurrent, about 1.55 conv/s maximum |
2.62 |
2.6 / 3.2 s |
Conversations with many long messages, such as batch-16 at 256 tokens, are more expensive. They take about 3.5–6 seconds each in isolation.
9. Sizing Guidance
-
Per 4-CPU pod: about 31 req/s maximum for short PII-bearing texts, or about 1.5 conversations/s for 40-message conversations.
-
Planning target: use about 20 req/s per pod to keep p95 latency low and preserve headroom.
-
Pod count: use
ceil(peak req/s ÷ 20), with a minimum of two pods for availability. -
RAM: measured runtime need is about 1.4 GiB peak. Recommended starting point is request 1.5 Gi and limit 2 Gi, subject to confirmation in a staging soak.
-
CPU: keep 4 CPU with
ONNX_THREADS=4. If the CPU limit changes, updateONNX_THREADSto match.
CPU usage is not fully linear at low traffic. At 5 req/s, the pod already uses about 2 cores, even though actual inference work is closer to 0.6 core. This is most likely caused by ONNX Runtime thread spin-wait behavior because the loader does not currently set session.intra_op.allow_spinning. As a result, an HPA target of 70% on a 4-CPU request may scale out around 10–12 req/s, before the pod reaches its measured 31 req/s capacity.
Recommended follow-up: evaluate allow_spinning=0 or consider scaling on request rate instead of CPU.
10. Capacity and Known Limits
-
Per-pod capacity: about 31 req/s for short PII-bearing texts at 4 CPUs, or about 20–26 req/s with
ONNX_THREADS=2. -
Conversation latency: a 40-message conversation takes about 0.7 seconds alone and about 2.6 seconds with four concurrent requests.
-
Heavy conversations: a batch-16 conversation with long messages takes about 3.5–6 seconds alone and up to about 11 seconds under concurrent load.
-
Scaling model: scale horizontally with HPA pods. Do not add workers inside a pod.
-
Over-capacity behavior:
/mask/conversationrequests beyond the four-slot admission gate receive503withRetry-After. In c=8 validation, the service returned 4 successful responses and 4 graceful rejections, with no 504s. -
Known ML gap: split-card formats with four separate digit groups remain a tracked detection gap.