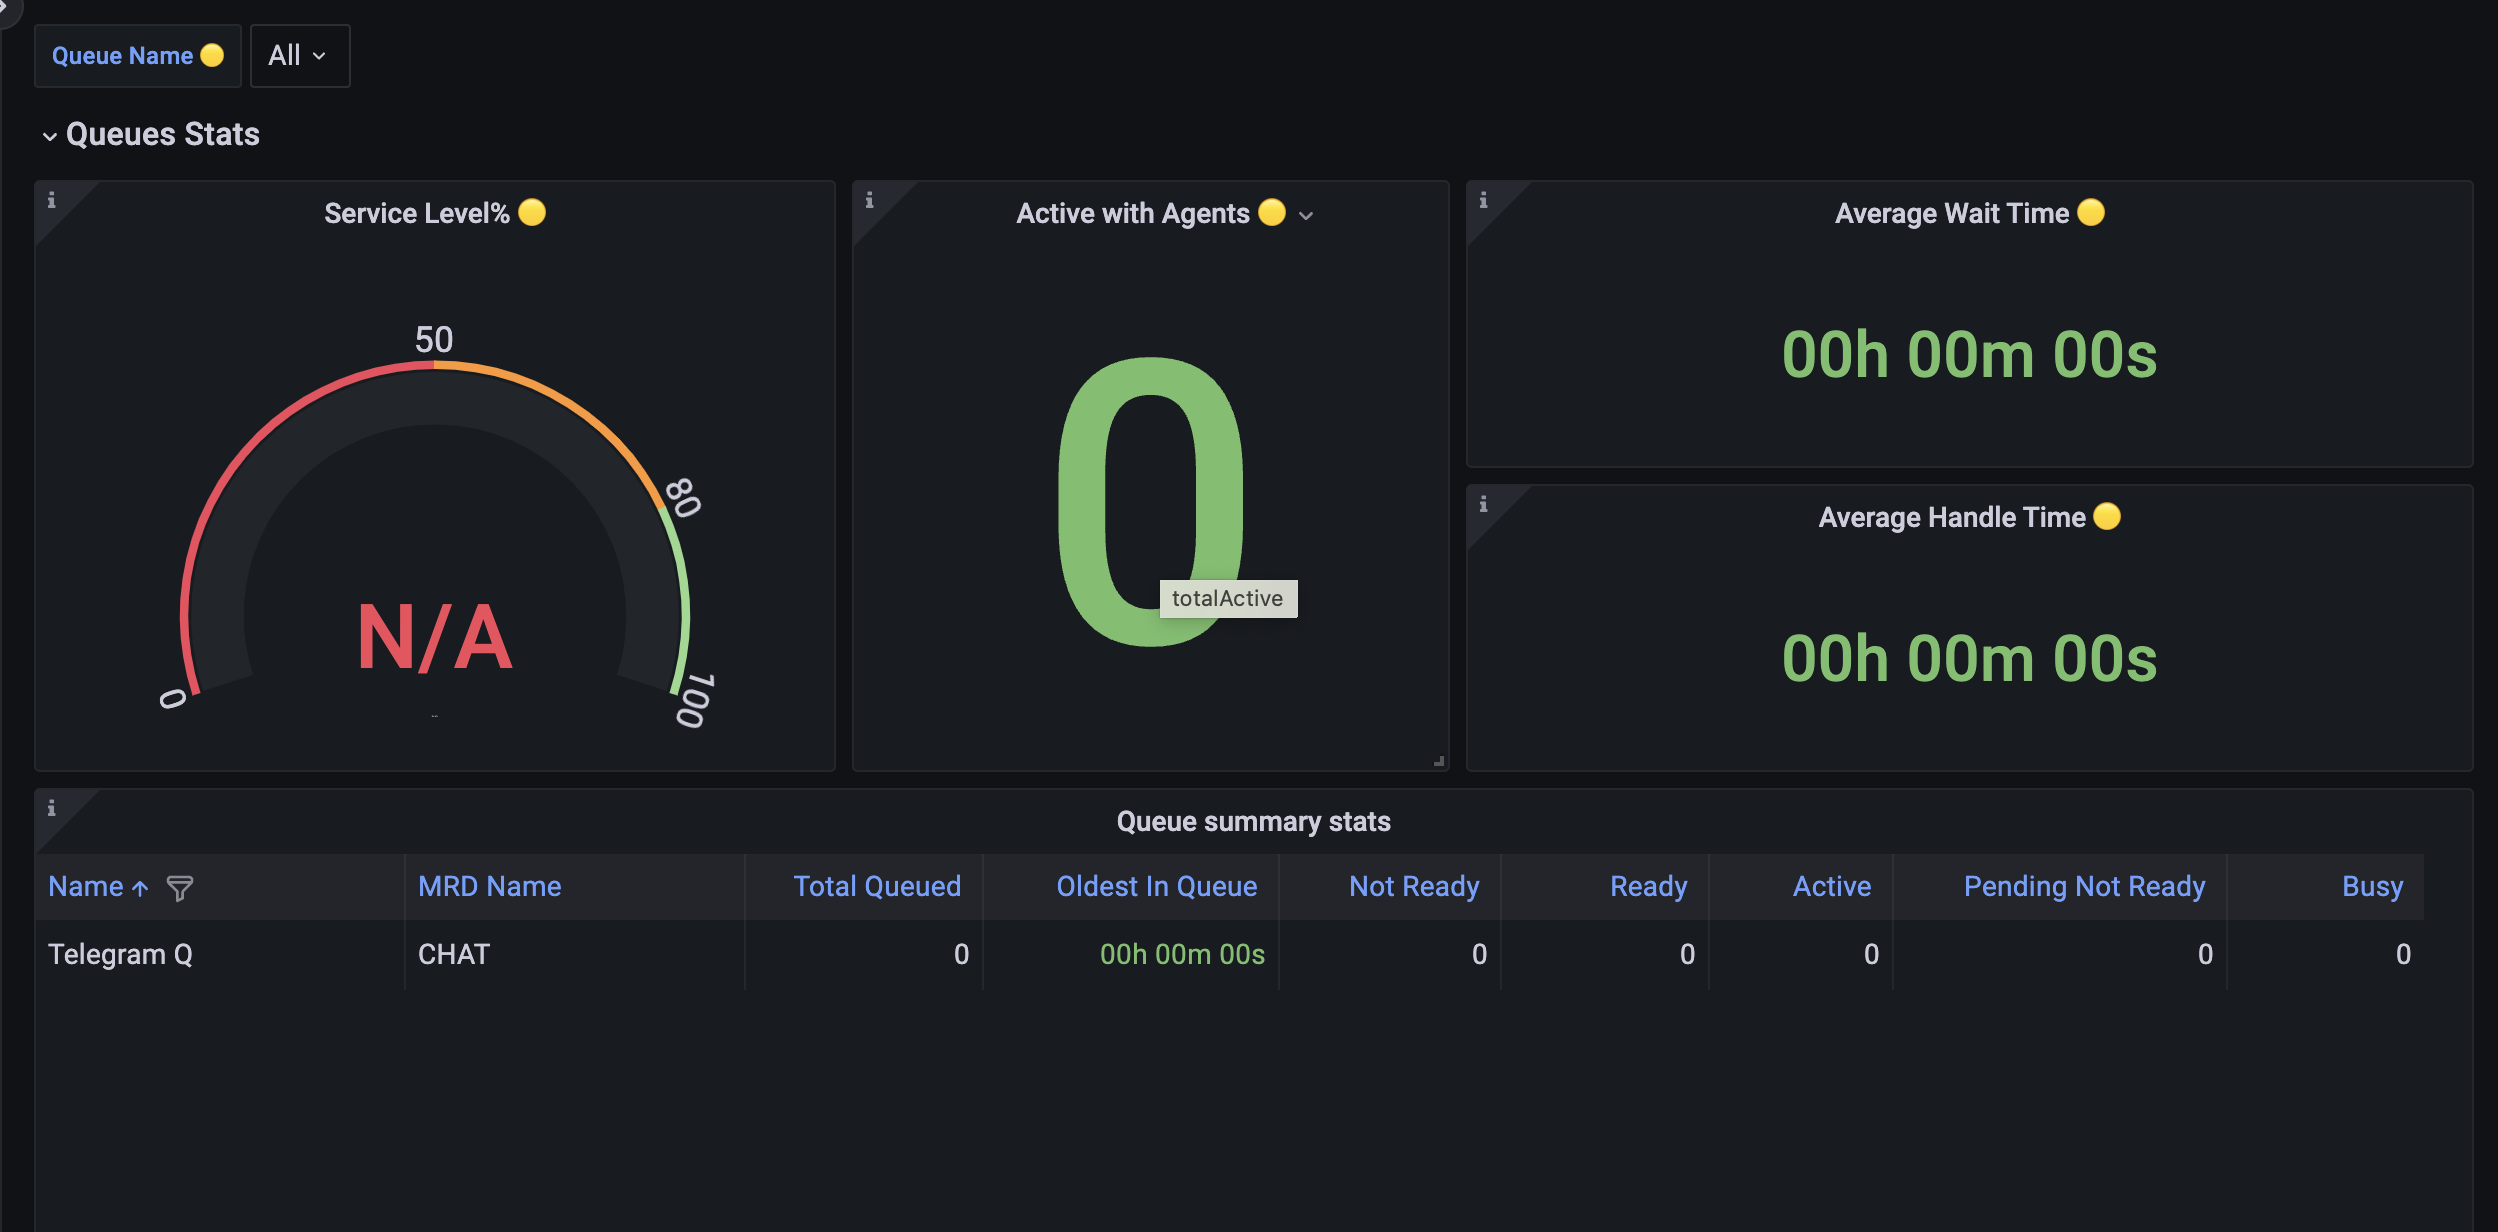
The dashboards embedded in Agent Desk are real-time dashboards for agents and supervisors to view the contact center's summary statistics, including queues, their states, and ongoing real-time conversations with agents and bots.
The following two dashboards are available for agents:
-
Summary Dashboards
-
Active Agents Detail
After logging in, the default view is the Summary Dashboard view.
Summary Dashboards
Users with the ‘Agent’ role can see the Queues list on top of the dashboard which enlists the queues only of which the agent is a part. Select one or multiple queues to see the stats.

For details, see Realtime Reporting and Dashboards → Summary Dashboard
When logging in as an agent, the Summary dashboard appears as the first screen after logging in. However, agents can only view the following panels in the Summary dashboard:
-
Queues Stats - with queues only which he is a part of
-
Queue Summary Stats - with queues only which he is a part of
Supervisors will be able to see all the rest of the panels as well.
Active Agents Detail
This dashboard enables an agent to view all agents of his team who are currently active
including their state, number of active conversations, and the state of subscribed MRDs.
For details on this dashboard, see Realtime Reporting and Dashboards → Active Agent Detail Dashboard

Agents can also access this dashboard. When logged in as an agent, they can only view their own team states only.