
|
Report Summary |
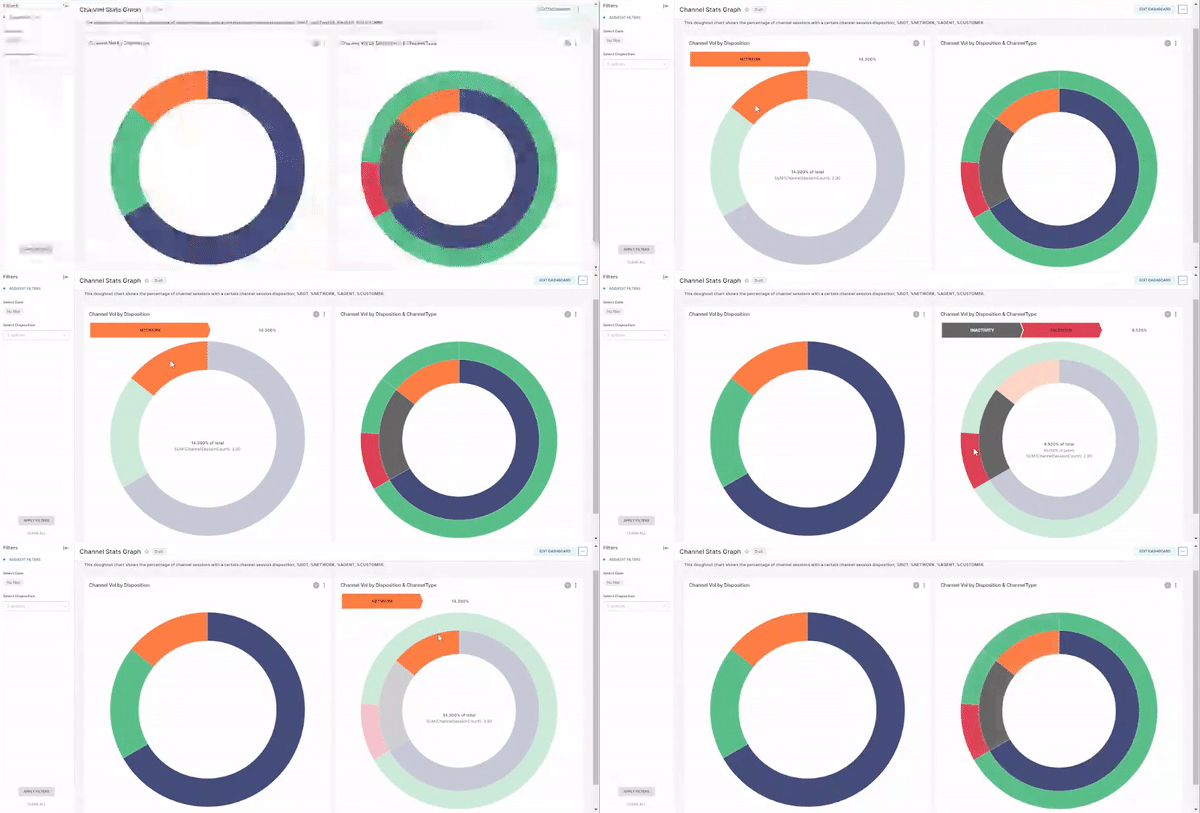
Shows the percentage of channel sessions closed due to a particular disposition. |
|---|
This report shows the percentage in the form of a doughnut chart with one of the following channel disposition; i.e.
-
% Customer
-
% Agent
-
% Inactivity
-
% Network
-
% Force Closed
See Channel Session Detail for more on the channel session dispositions above.
This helps to determine how many sessions were closed due to a particular disposition.
There are two views available for this report:
-
Channel Vol by Disposition - simple doughnut showing disposition-wise slices regardless of the channel type
-
Channel Vol by Disposition and Channel type - a double-layer doughnut where the outer layer shows the channel type and the inner slices show channel session dispositions of the selected channel type.
Report Filters
-
Disposition: Bot | Customer | Agent | Network. If no disposition is selected, it shows the data of all dispositions. The filter applies to both of the two charts.
-
Date/Time: The filter applies to both charts.