The purpose of this document is to provide deployment steps for Cisco Outbound connector of Expertflow CX solution.
Pre-requisites
Before you begin, verify
- EF CX is deployed.
- Cisco UCCX is set up with API-created campaigns
- CISCO connector is deployed
- Redis is installed using the bellow setup
Install Redis
sudo apt-get install lsb-release curl gpg
curl -fsSL https://packages.redis.io/gpg | sudo gpg --dearmor -o /usr/share/keyrings/redis-archive-keyring.gpg
sudo chmod 644 /usr/share/keyrings/redis-archive-keyring.gpg
echo "deb [signed-by=/usr/share/keyrings/redis-archive-keyring.gpg] https://packages.redis.io/deb $(lsb_release -cs) main" | sudo tee /etc/apt/sources.list.d/redis.list
sudo apt-get update
sudo apt-get install redis
After installing Redis, enable and start it:
systemctl enable redis
systemctl enable redis-server
systemctl start redis
systemctl start redis-server
Run the following command, but replace PASSWORD with your desired Redis password:
sed -i '/# requirepass/c\requirepass PASSWORD' /etc/redis/redis.conf
Run the following commands:
sed -i '/protected-mode/c\protected-mode no' /etc/redis/redis.conf
sed -i '/bind 127.0.0.1 -::1/c\# bind 127.0.0.1 -::1' /etc/redis/redis.conf
sed -i '/bind 127.0.0.1 ::1/c\# bind 127.0.0.1 ::1' /etc/redis/redis.conf
Restart Redis:
systemctl restart redis
systemctl restart redis-server
Campaign studio update
Update the Campaign studio build tag in helm-values/mtt-single-custom-values.yaml
campaign-studio:
  image:
      repository: cim/conversation-studio/build
      tag: "5.1_f-CIM-32967"
Deploy
helm upgrade --install --namespace <tenant-ns> --debug <tenant-id> --values helm-values/mtt-single-custom-values.yaml expertflow/MTT-single --version 5.1.0
Setup cisco outbound connector
# Create cisco-connector directory from root
  mkdir 5.1.0_f-CIM-32967
# Navigate to 5.1.0_f-CIM-32967
  cd 5.1.0_f-CIM-32967
# Clone the 5.1.0_f-CIM-32967 branch of the cim-solution repository
  git clone -b 5.1.0_f-CIM-32967 https://efcx:RecRpsuH34yqp56YRFUb@gitlab.expertflow.com/cim/cim-solution.git $HOME/5.1.0_f-CIM-32967
# Navigate to root(previous) directory
  cd 5.1.0_f-CIM-32967/kubernetes
Create namesapce:
kubectl create namespace cisco-voice
Copy GITLAB secrets
kubectl get secret ef-gitlab-secret -n expertflow -o yaml | sed 's/namespace: expertflow/namespace: cisco-voice/' | kubectl create -f -
update the following variables in :
-
CISCO_FQDN: The address of the Cisco deployment.
-
CISCO_USERNAME: The admin username of the Cisco deployment.
-
CISCO_PASS: The admin password of the Cisco deployment.
-
CISCO_TYPE: CCX or CCE, depending on the Cisco deployment.
-
CX_FQDN: The address of EF CX. https://FQDN
-
DB_NAME: The name of the Cisco database.
-
CCX: default db_cra
-
CCE: The database where the Dialer_Detail(CCE) table is located.
-
-
DB_IP: The server IP address of the Cisco database.
-
DB_PASS: The password of the Cisco database.
-
DB_PORT: The port of the Cisco database.
-
CCX: default 1504
-
CCE: default 1433
-
-
DB_USERNAME: The username of the Cisco database.
-
CCX: default uccxhruser
-
CCE: default sa
-
-
LOG_LEVEL: The amount of detail in the logs. Default is INFO, and for more detailed logs the value should be DEBUG.
-
REDIS_DB: The index of the Redis cache where call IDs will be stored. Can be a number from 0 through 16.
-
REDIS_HOST: The server IP address of the Redis cache.
-
REDIS_PASS: The password of the Redis cache.
-
REDIS_PORT: The port of the Redis cache. The default is 6379.
-
REDIS_DELAY: The time in minutes the connector will wait between checking call results for the call IDs stored in the Redis cache.
-
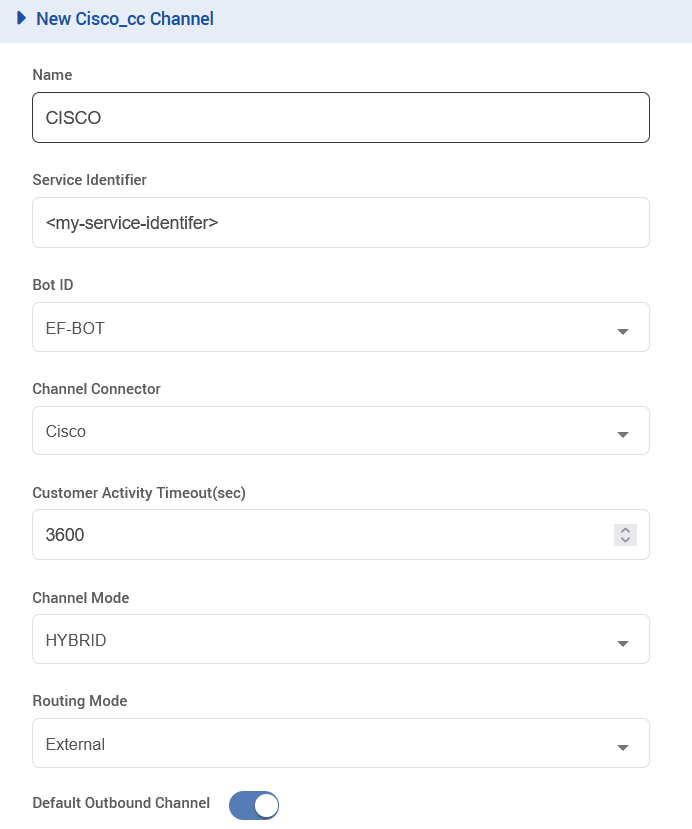
SERVICE_ID: Service Identifier for the connector set in the EF CX Unified Admin channel settings.
-
AUTH_ENABLED: true or false depending on whether APISIX authentication is enabled in EFCX. The four settings below are set if this value is true.
-
API_USERNAME: The username created in Keycloak for API authentication.
-
On Keycloak create a user in the Expertflow realm.
-
Assign the admin and default roles, and have Email-Verified option enabled.
-
Assign a non-temporary password to this user as well.
-
-
API_PASS: The password for the above user created in Keycloak for API authentication
-
CLIENT_ID: Should always be cim.
-
CLIENT_SECRET: Found on Keycloak in the cim client.
Deploy cisco-outbound connector
helm upgrade --install cisco-outbound /root/5.1.0_f-CIM-32967/kubernetes/helm/cisco-outbound-connector -n cisco-voice
Configure Unified Admin
-
Open Unified Admin and navigate to Channel Provider.
-
Add a new provider
-
Name: CISCO
-
Supported Channel Type: CISCO_CC
-
Provider Webhook: http://cisco-outbound-cisco-outbound-connector-svc.cisco-voice.svc:8080/ccm-msg/receive
-
-
Add a new Channel Connector with this Provider
-
Name: CISCO
-
Channel Provider Interface: CISCO
-
-
Create a new Channel of type CISCO_CC, using the following configurations, and replace the Service Identifier field with the identifier set in the connector deployment variable named SERVICE_ID.
Deploy Transflux
Clone the transflux repository
# Create 5.1.0_f-CIM-32439-trasnflux directory from root
  mkdir 5.1.0_f-CIM-32439-trasnflux
# Navigate to 5.1.0_f-CIM-32439-trasnflux
  cd 5.1.0_f-CIM-32439-trasnflux
# Clone the 5.1.0_f-CIM-32439 branch of the transflux repository
  git clone -b 5.1.0_f-CIM-32439 https://efcx:RecRpsuH34yqp56YRFUb@gitlab.expertflow.com/cim/transflux.git $HOME/5.1.0_f-CIM-32439-trasnflux
# Navigate to transflux directory
  cd transflux
Replace the existing configs with new ones as per following
-
/transflux/config/state_event_logger_data_pipeline_config_template.yamlwith5.1.0_f-CIM-32439-trasnflux/config/state_event_logger_data_pipeline_config_template.yaml -
/transflux/config/gold_15_minutes_queries_config_template.yamlwith5.1.0_f-CIM-32439-trasnflux/config/gold_15_minutes_queries_config_template.yaml -
/transflux/config/events_data_pipeline_config_template.yamlwith5.1.0_f-CIM-32439-trasnflux/config/events_data_pipeline_config_template.yaml -
/transflux/config/campaigns_data_pipeline_config_template.yamlwith5.1.0_f-CIM-32439-trasnflux/config/campaigns_data_pipeline_config_template.yaml -
/transflux/config/forms_data_pipeline_config_template.yamlwith5.1.0_f-CIM-32439-trasnflux/config/forms_data_pipeline_config_template.yaml -
/transflux/config/activities_data_pipeline_config_template.yamlwith5.1.0_f-CIM-32439-trasnflux/config/activities_data_pipeline_config_template.yaml -
/transflux/config/teams_data_pipeline_config_template.yamlwith5.1.0_f-CIM-32439-trasnflux/config/teams_data_pipeline_config_template.yaml
Delete the existing config maps and re-create them from transflux directory
# Delete existing config maps
k delete cm ef-transflux-config-cm -n expertflow

# Re-create the config maps
kubectl -n expertflow create configmap ef-transflux-config-cm --from-file=config
Edit the file helm-values/cx-transflux-custom-values.yaml in the transflux directory
image:
  repository: cim/cx-data-platform
  tag: "5.1.0_f-CIM-32439"
Redeploy the solution
helm upgrade --install --namespace expertflow --set global.efCxReleaseName="ef-cx" cx-transflux --debug --values helm-values/cx-transflux-custom-values.yaml expertflow/transflux --version 5.1.0
Deploy Reports:
cd /$HOME/5.1.0_f-CIM-32967/kubernates
Register database in metabase
Register database in metabase
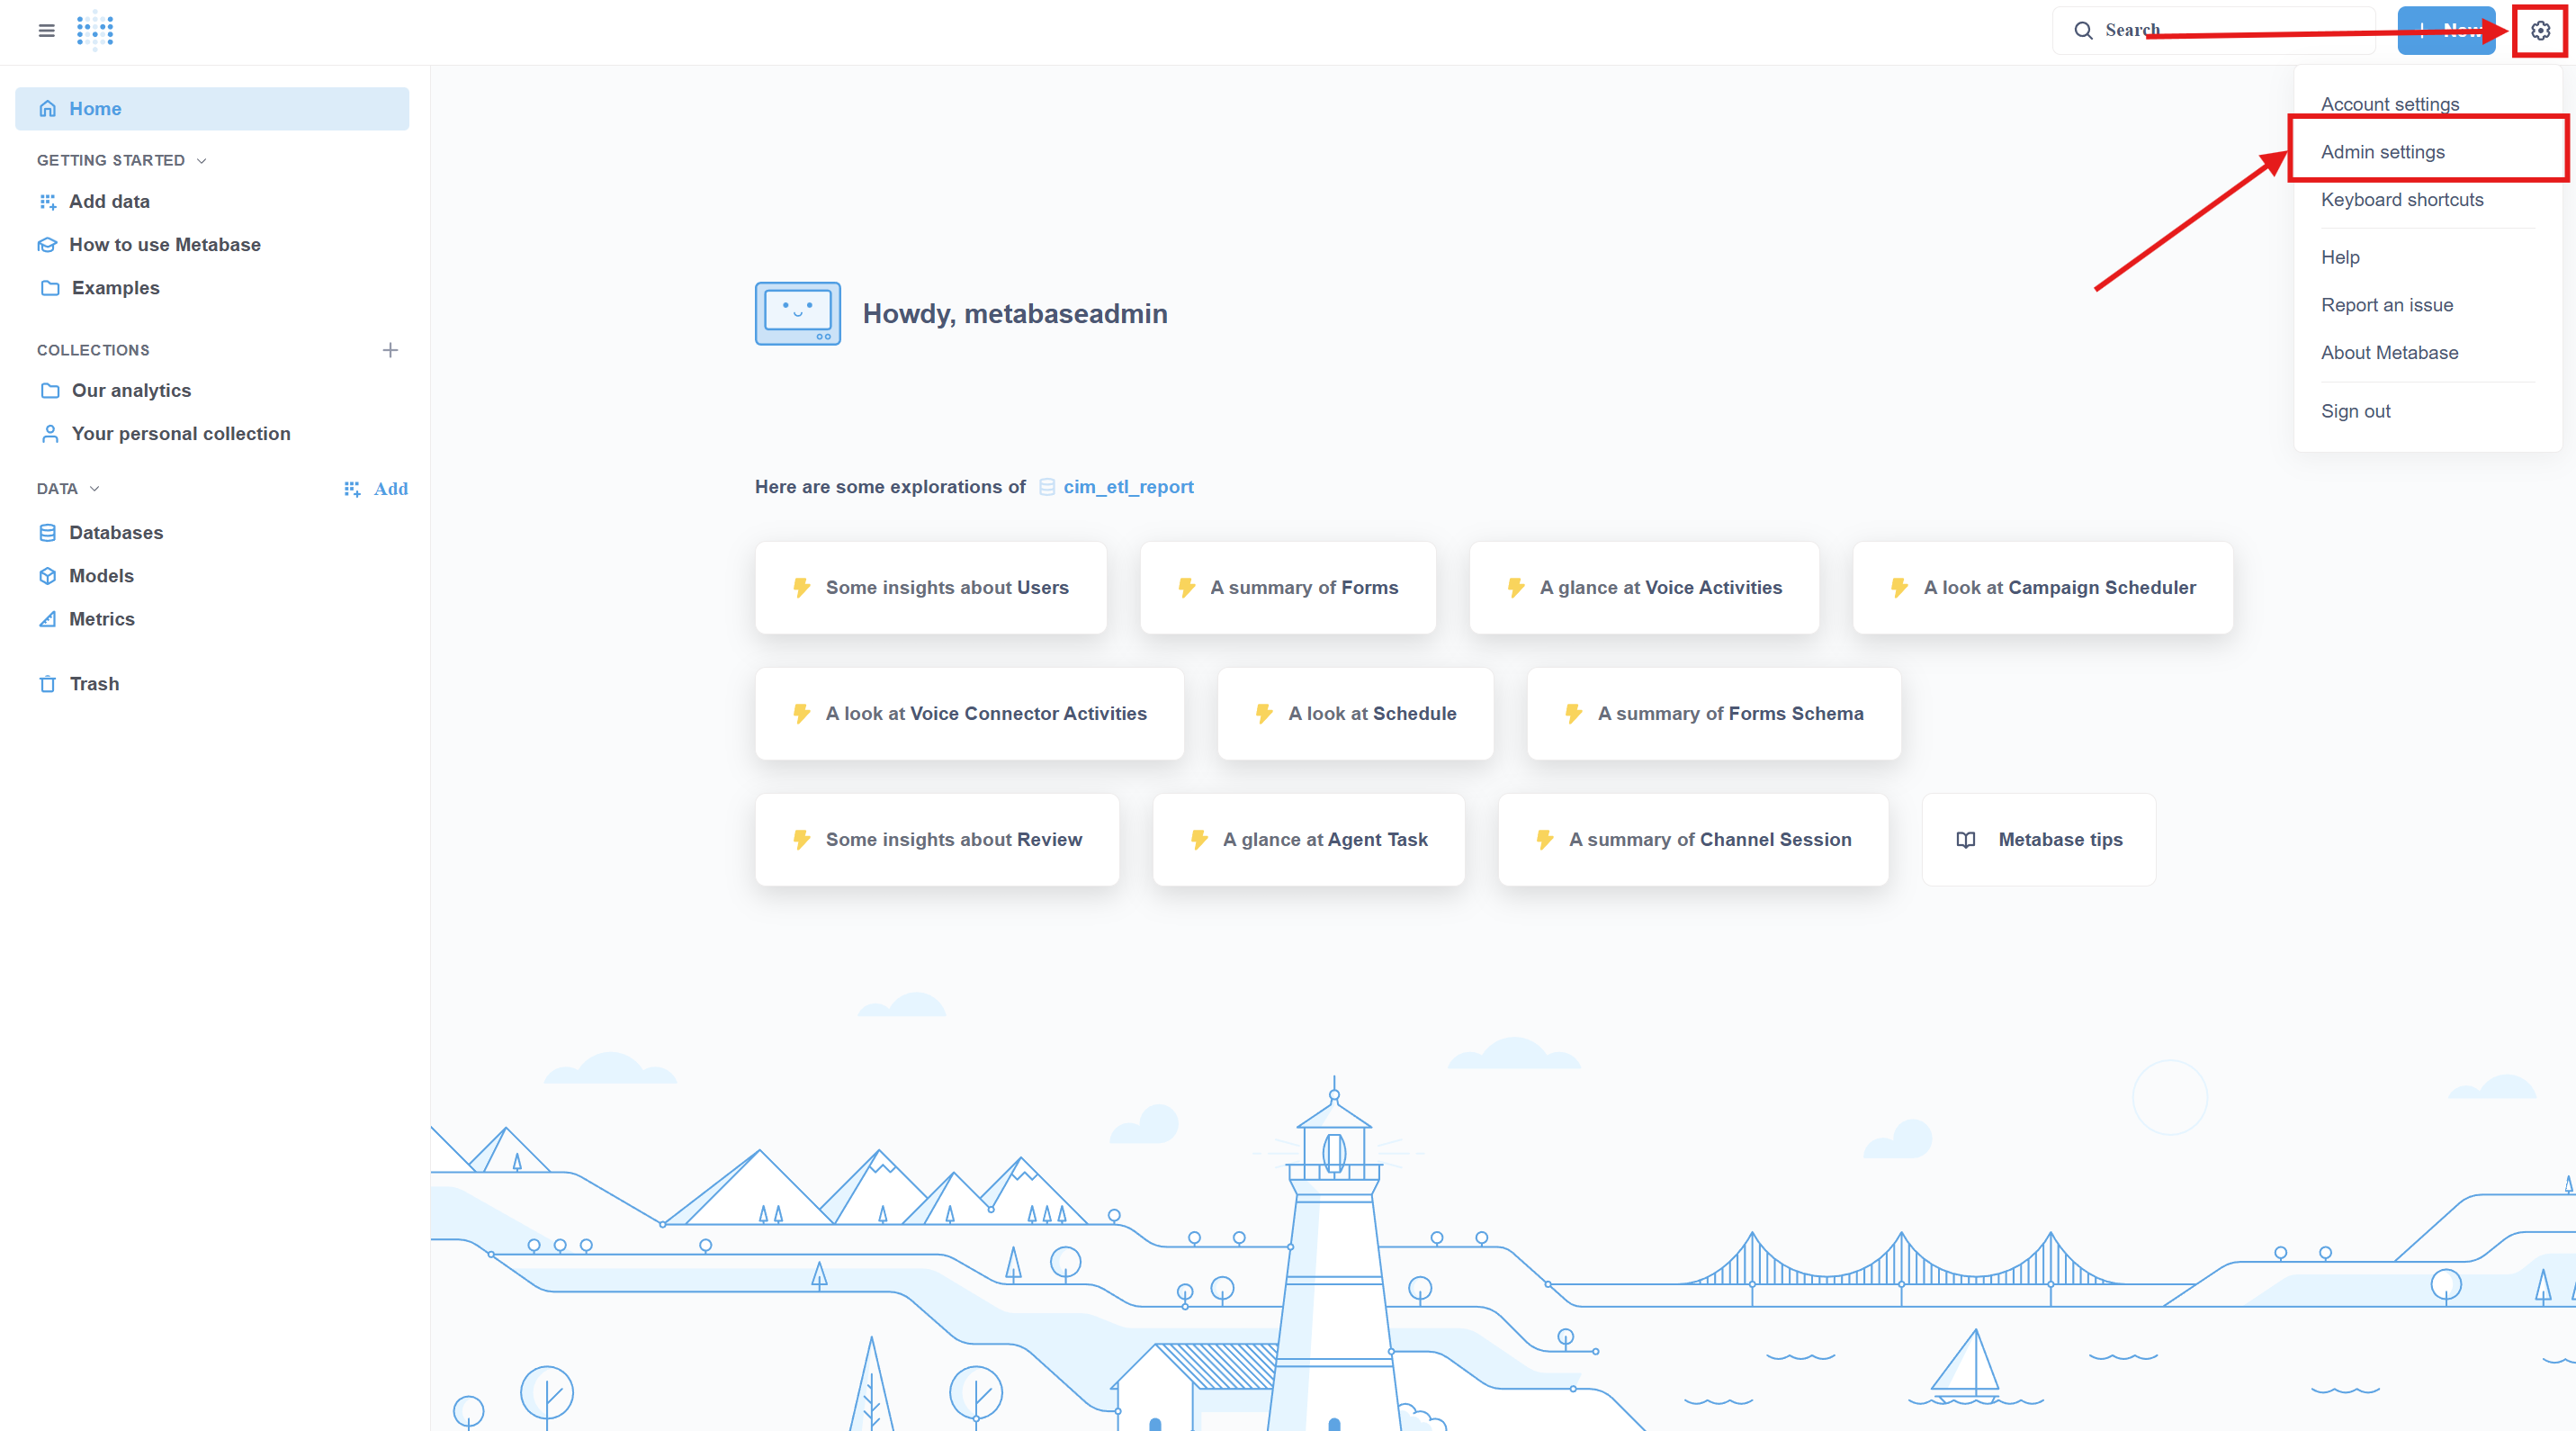
1. Go to Metabase and log in with the admin user.
2. Click on the settings gear icon, then click on admin settings:
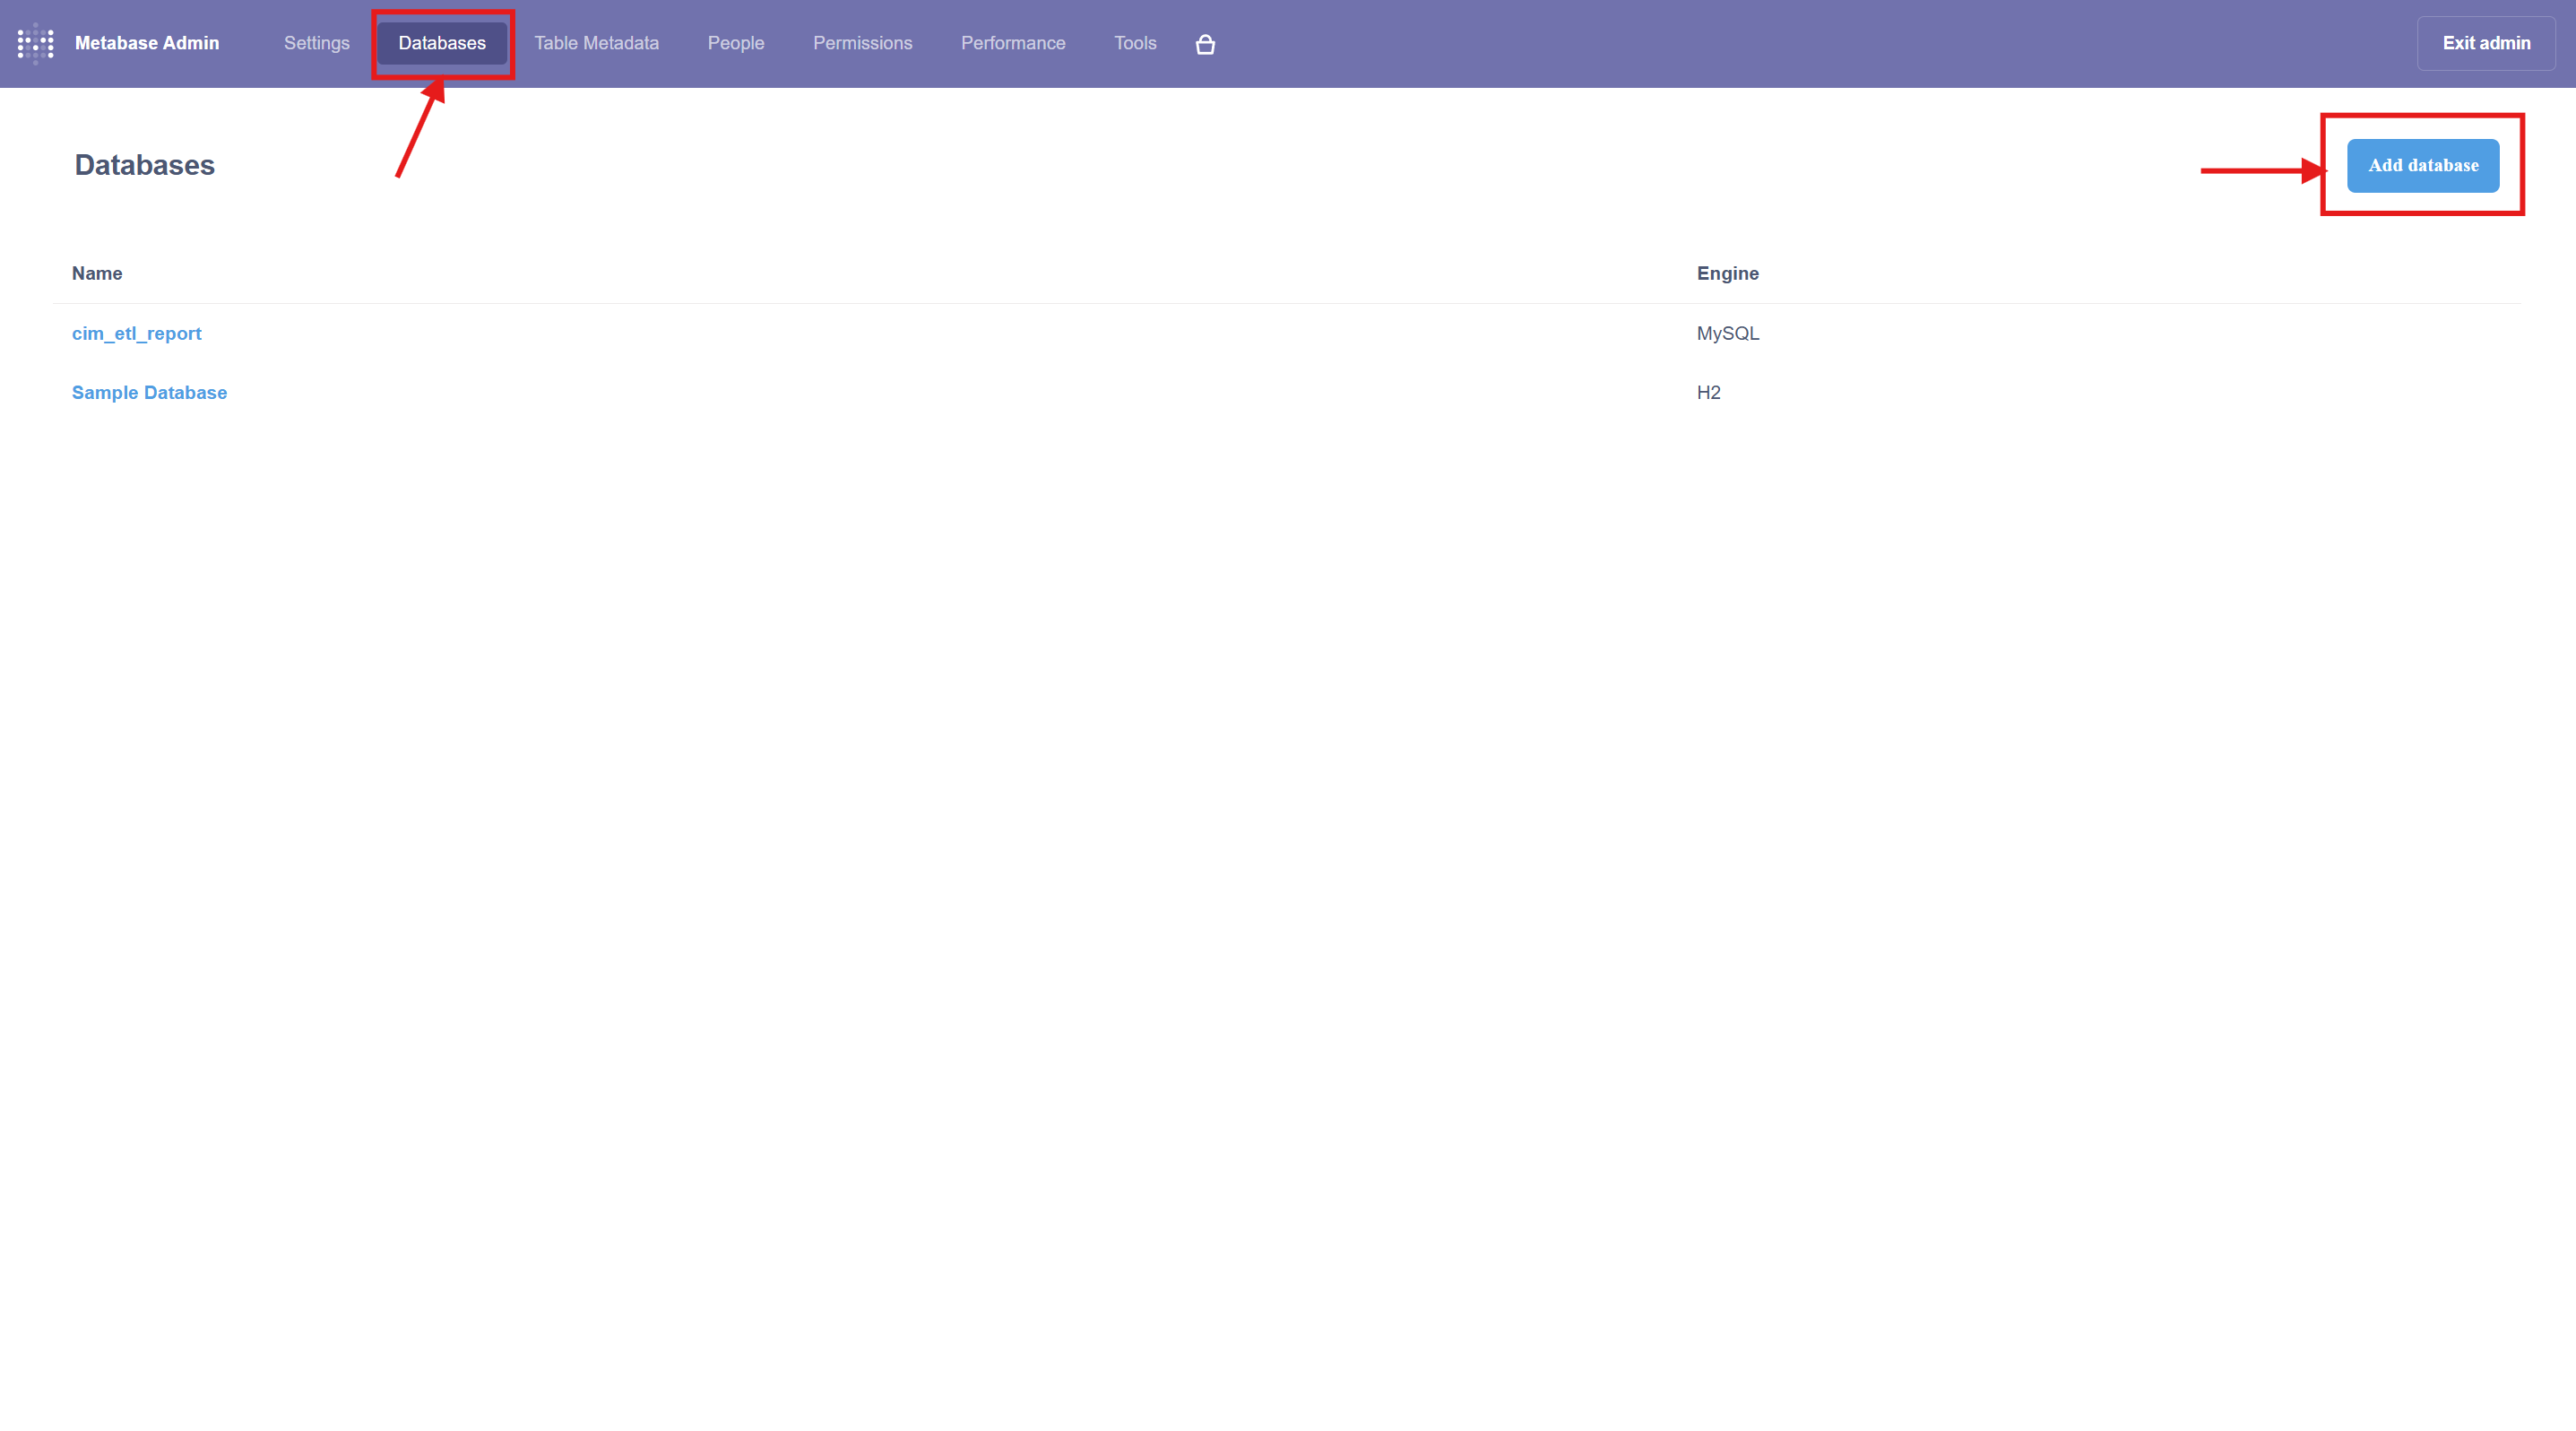
3. Then, on the admin page, click on databases, then click on Add database:
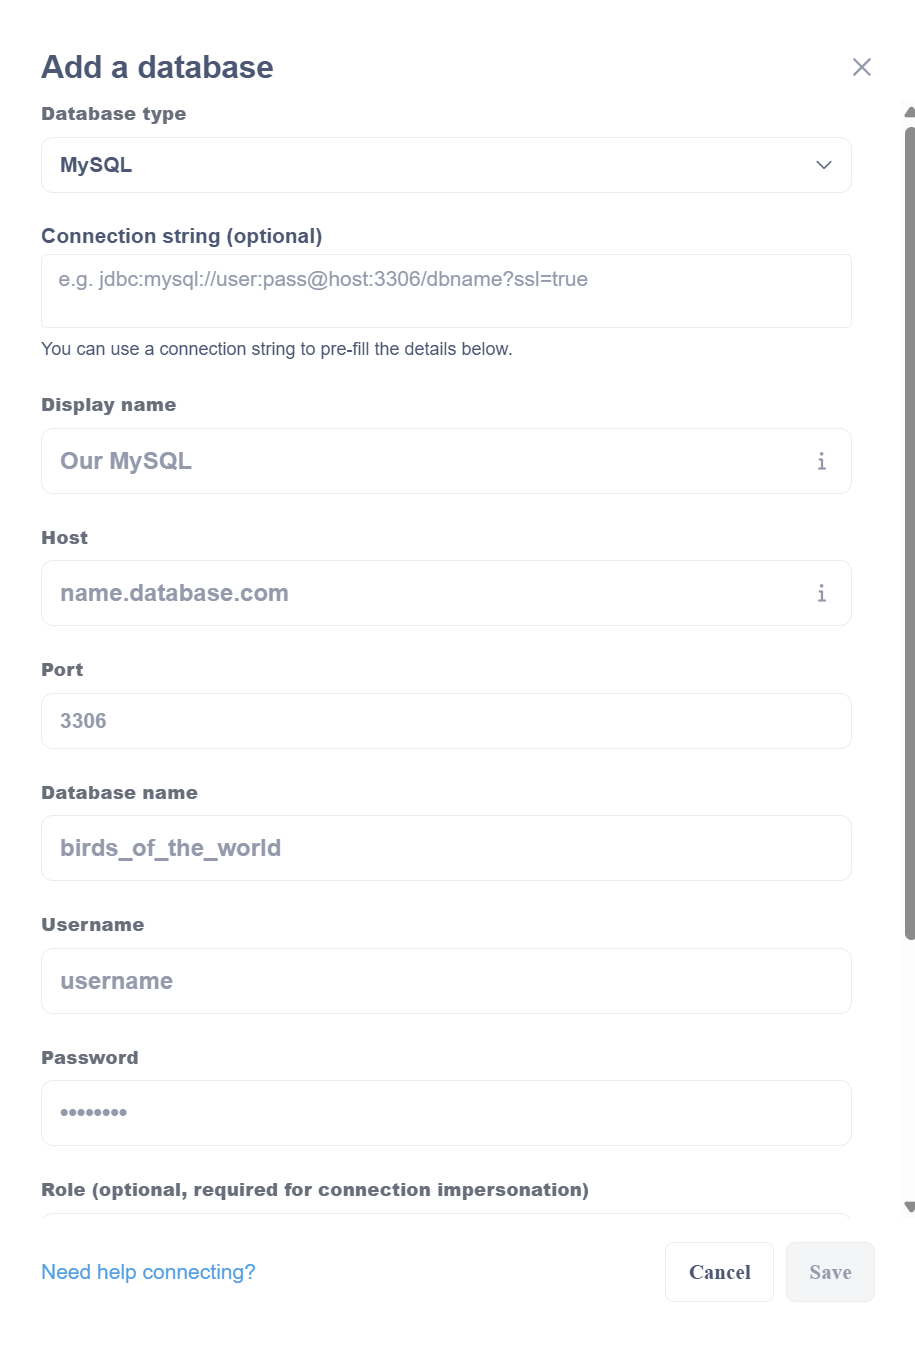
4. Add database and click save (Remember the Display name of the database, which we will use in the import command):
During update change database “expertflow” .
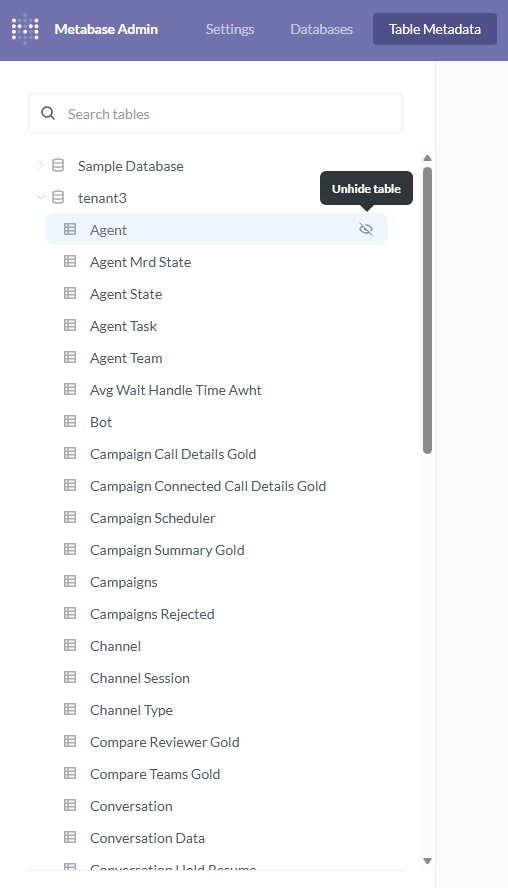
5. Once the connection is successful,go to Table Metadata to verify that all the tables are visible.
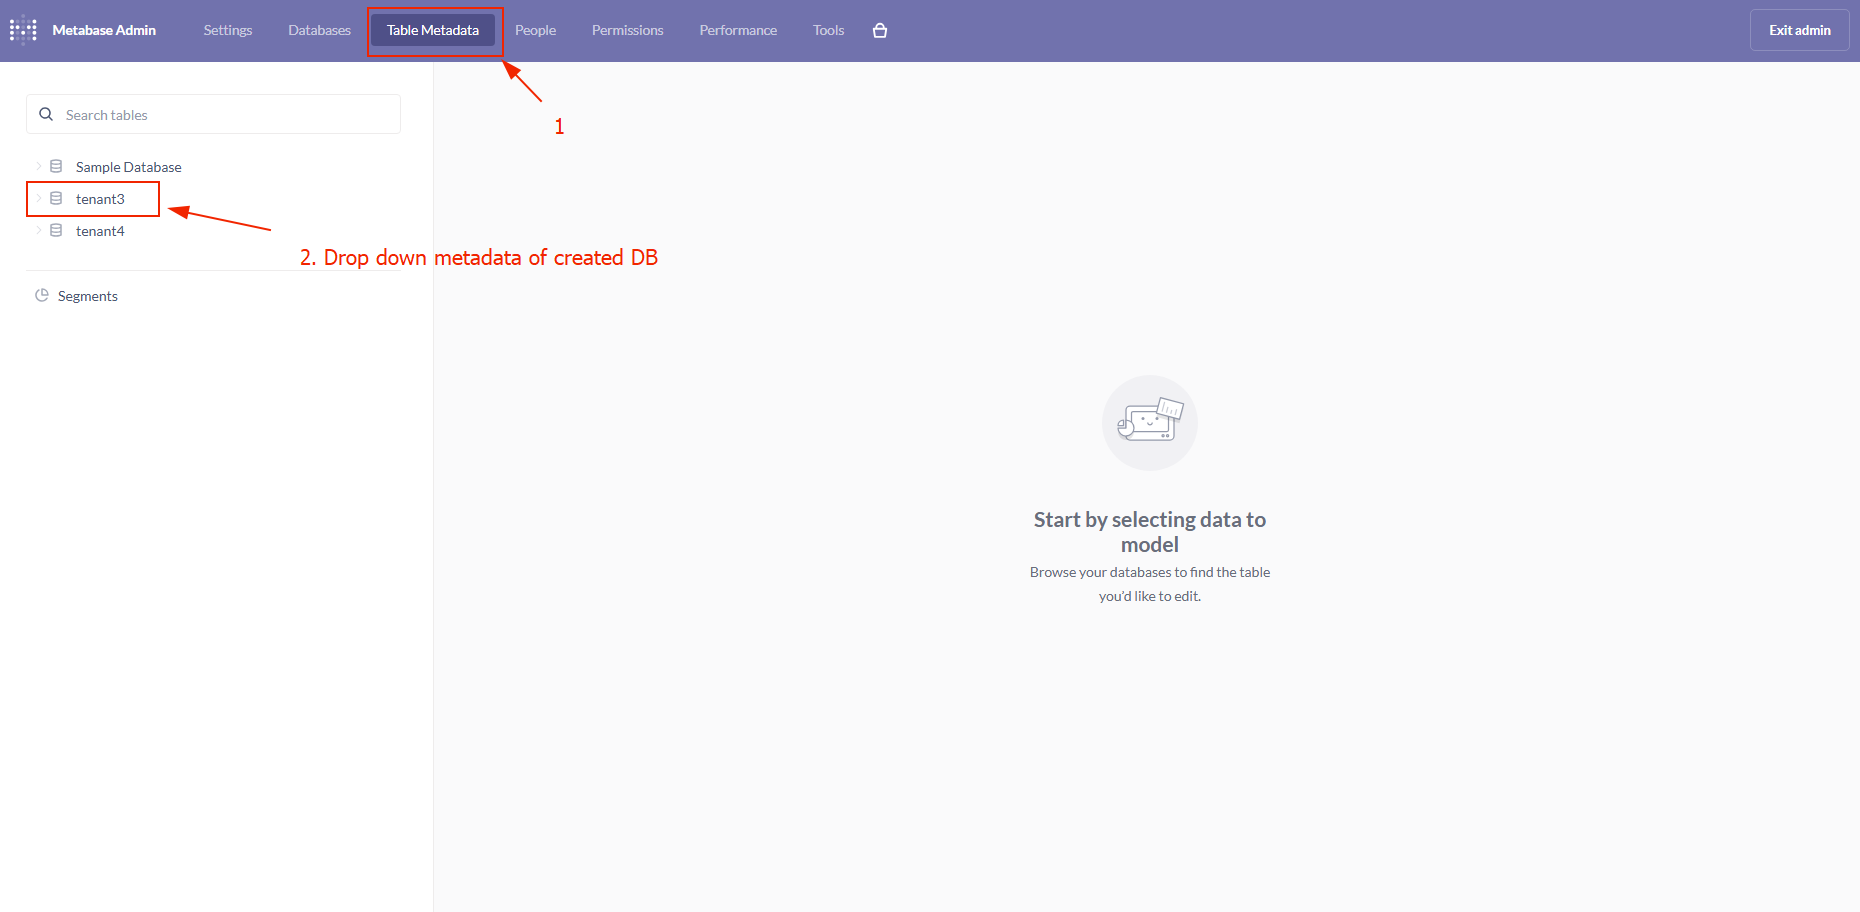
6. Please make sure that all the tables are not hidden. If any table is hidden, unhide the table by clicking the cross-eye icon.
Navigate to the reports artifacts directory
cd /$HOME/5.1.0_f-CIM-32967/kubernetes/external/metabase-reports/metabase_reporting_update_tool/
From here onward, we assume the repo contains "campaigns" and "survey" directories with their respective report artifacts within "/metabase_reporting_update_tool". If the directory structure changes, update the commands below accordingly.
To import Campaigns reports
python3 metabase_import.py https://<Metabase-FQDN>/metabase/api/ <admin-email> <admin-password> <metabase-db-display-name> mysql <collection-name-on-metabase>
-
<metabase-db-display-name> = It is the database name that we set while configuring a DB on metabase.
-
<collection-name-on-metabase> = It is the collection that we create on metabase interface.
example: python3 metabase_import.py https://rm-03.expertflow.com/metabase/api/ <admin-email> <admin-password> mtt02 mysql Campaigns_mtt02_test
Deploy Grafana dashboard
Expose port for the Prometheus
-
get svc from namespace where Prometheus is deployed
k get svc -n <namespace>
-
replace svc and namespace
kubectl patch svc <Prometheus-svc> -n <namespace> --type='json' -p '[{"op":"replace","path":"/spec/type","value":"NodePort"}]'
-
get port from svc
k get svc -n <namespace>
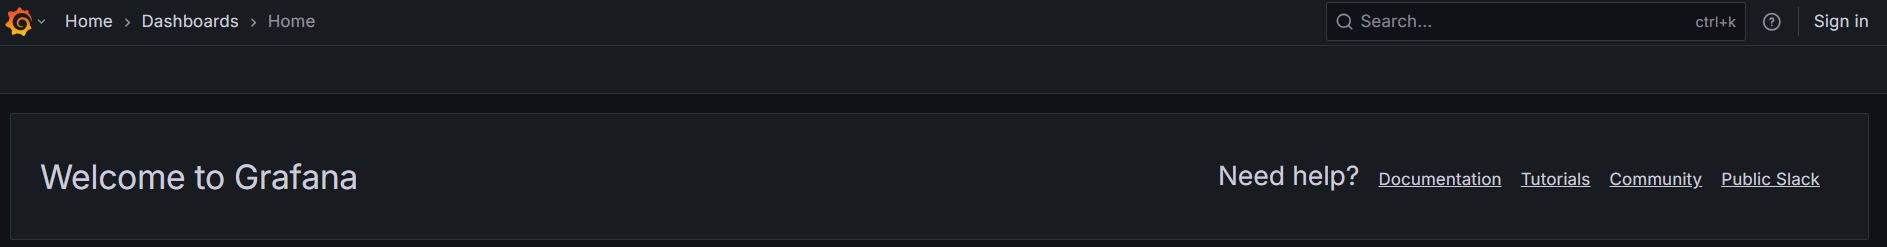
Access Grafana
Open your browser and navigate to the following URL:
https://<FQDN>/grafana
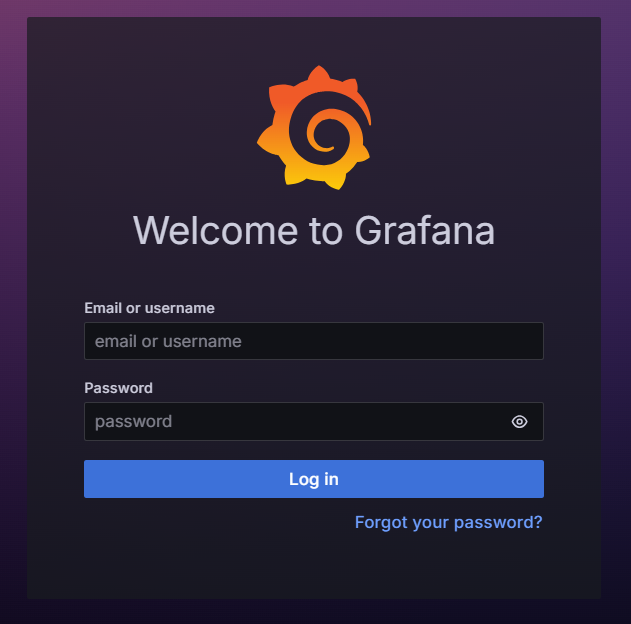
2. Sign In to Grafana
Use the provided Grafana credentials:
-
Username / Email:
admin -
Password:
Expertflow123
3. Configure Prometheus Data Source
The Campaign Studio Dashboard uses Prometheus as its data source.
Ensure that the Prometheus data source is configured correctly in Grafana before accessing the dashboard.
From the Grafana menu, navigate to Connections → Data sources, and configure Prometheus as the data source for the dashboard.
Data Source Details
|
Field |
Value / Example |
|---|---|
|
Type |
Prometheus |
|
Name |
Prometheus (or any custom name) |
|
Connection |
Prometheus server URL |
|
|
|
|
|
ℹ️Note Replace |
|
TLS Settings |
Check: Skip TLS certificate validation |
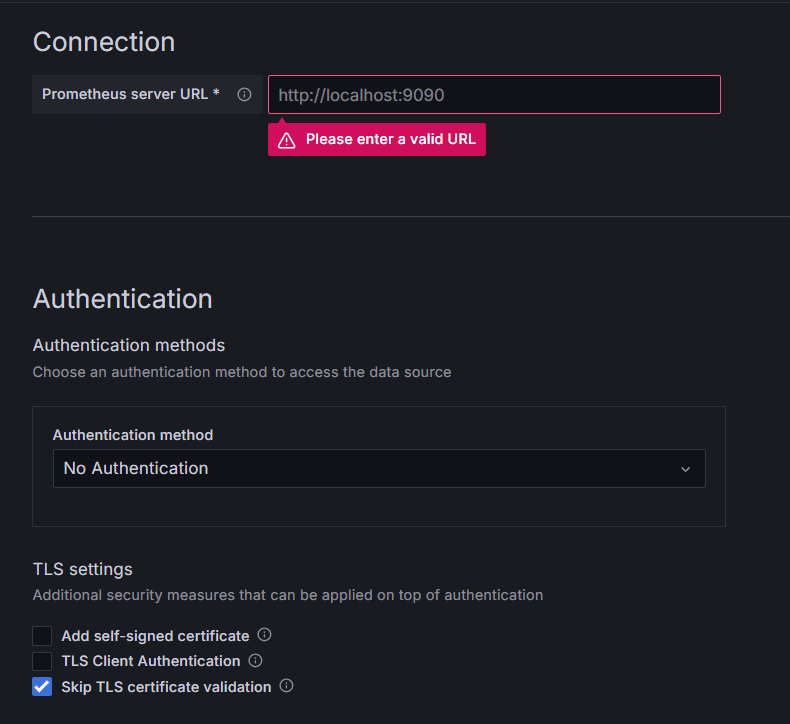
Validate the Connection
After configuring the data source:
-
Click Save & Test
-
Ensure that a success message is displayed, confirming Grafana can connect to Prometheus
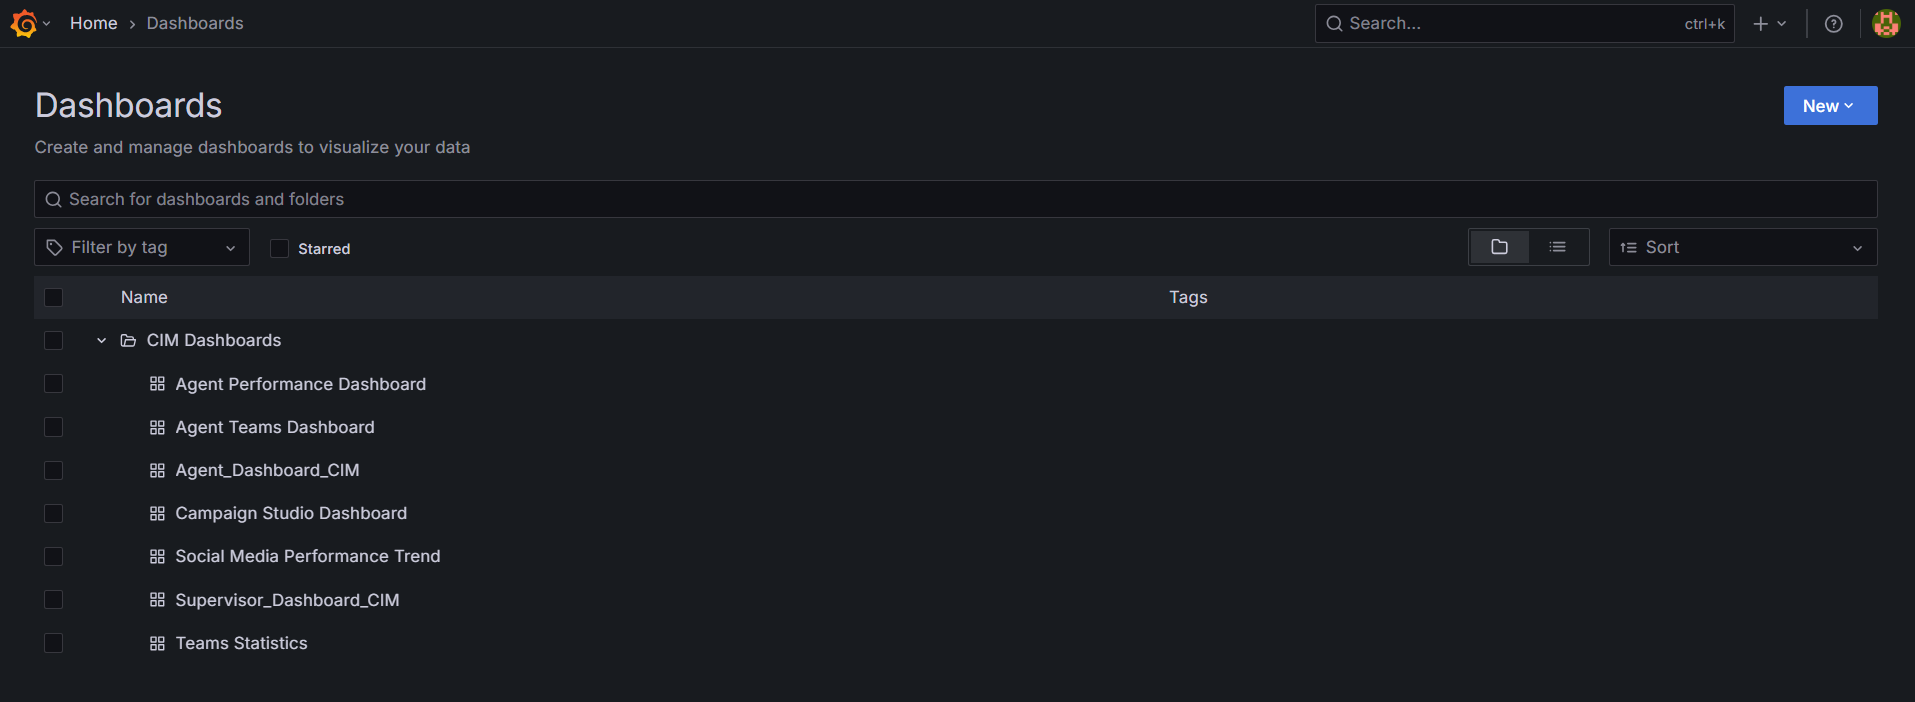
Open the CIM Dashboard
-
From the Grafana home page, click on Dashboards.
-
Select and open the CIM Dashboard.
-
Within the CIM Dashboard, click on new button then import.
-
Upload this file Campaign Studio Dashboard-1776165657488.json
-
Select prometheus data source from prometheus dropdown
-
Click on import it will successfully import the dashboard and navigate you to the dashboard
5. Using the Campaign Studio Dashboard
The Campaign Studio Dashboard provides interactive visualizations based on the following variables:
Available Variables
-
Channel Type
-
Flow ID
You can select the required values from the available options for each variable.
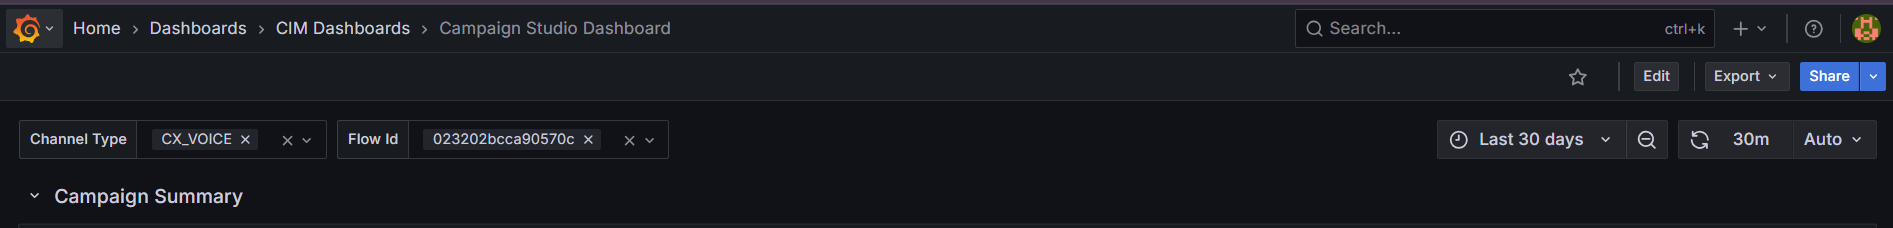
6. Dashboard Visualization
Once the variables are selected:
-
The dashboard dynamically updates
-
Different campaign states and metrics are visualized based on the selected Channel Type and Flow ID
This allows users to monitor and analyze campaign behavior effectively.