1. Executive Summary
This report details the findings of a performance load test conducted on the core application infrastructure. The objective was to evaluate the stability and resource consumption of the system during high-concurrency scenarios. Key findings indicate a successful handling of message throughput.
2. Infrastructure & Deployment Map
The application is distributed across two primary virtual environments:
-
VM1 (Core Services): Core Logic, Channels, Campaigns, QM, Reporting, Vault, Transflux, MongoDB, ActiveMQ, Redis, Minio, PostgreSQL, and ClamAV.
-
VM2 (Analytics): Metabase.
3. Performance Metrics
3.1 CPU Utilization (Cores)
|
Component |
Before Test |
During Load |
After Test (Recovery) |
|
Overall System |
~2.000 |
~2.9 - ~3.0 |
~2.000 |
3.2 Memory Usage (RAM)
The overall system memory footprint increased by approximately 2 GiB during the test.
|
Component |
Before Test |
During Load |
After Test (Recovery) |
|
Overall System |
~17.0 GiB |
~18.0 GiB |
~17.5 GiB |
4. Operational Observations
-
Throughput: The system successfully processed a high volume of traffic, with the exact total message count as expected.
-
Resource Elasticity: The system demonstrated excellent recovery, returning to baseline immediately.
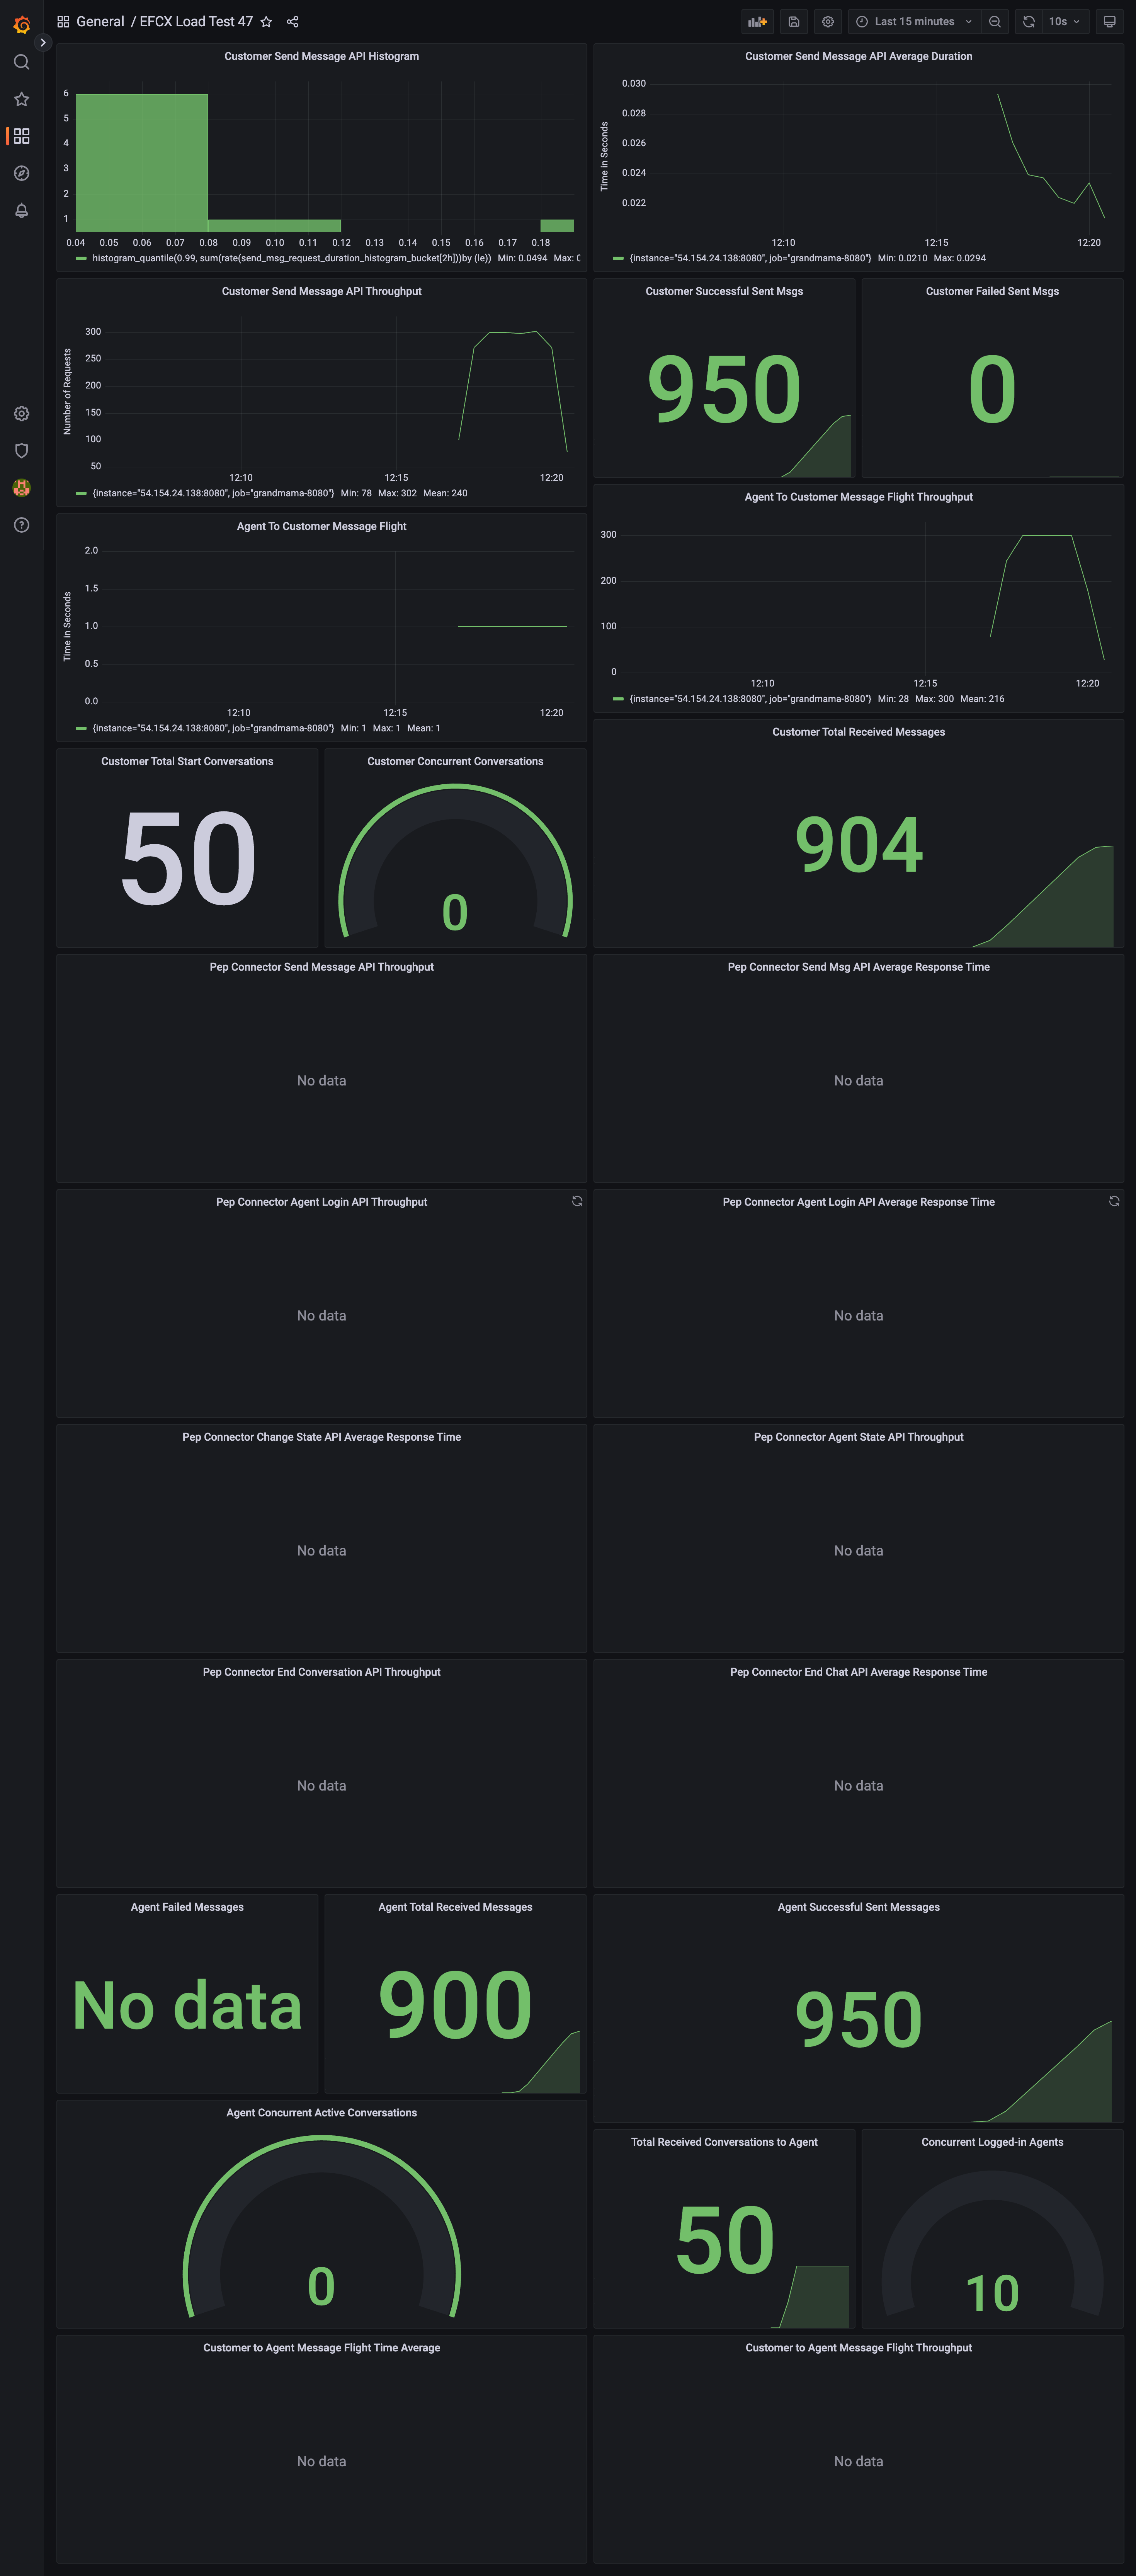
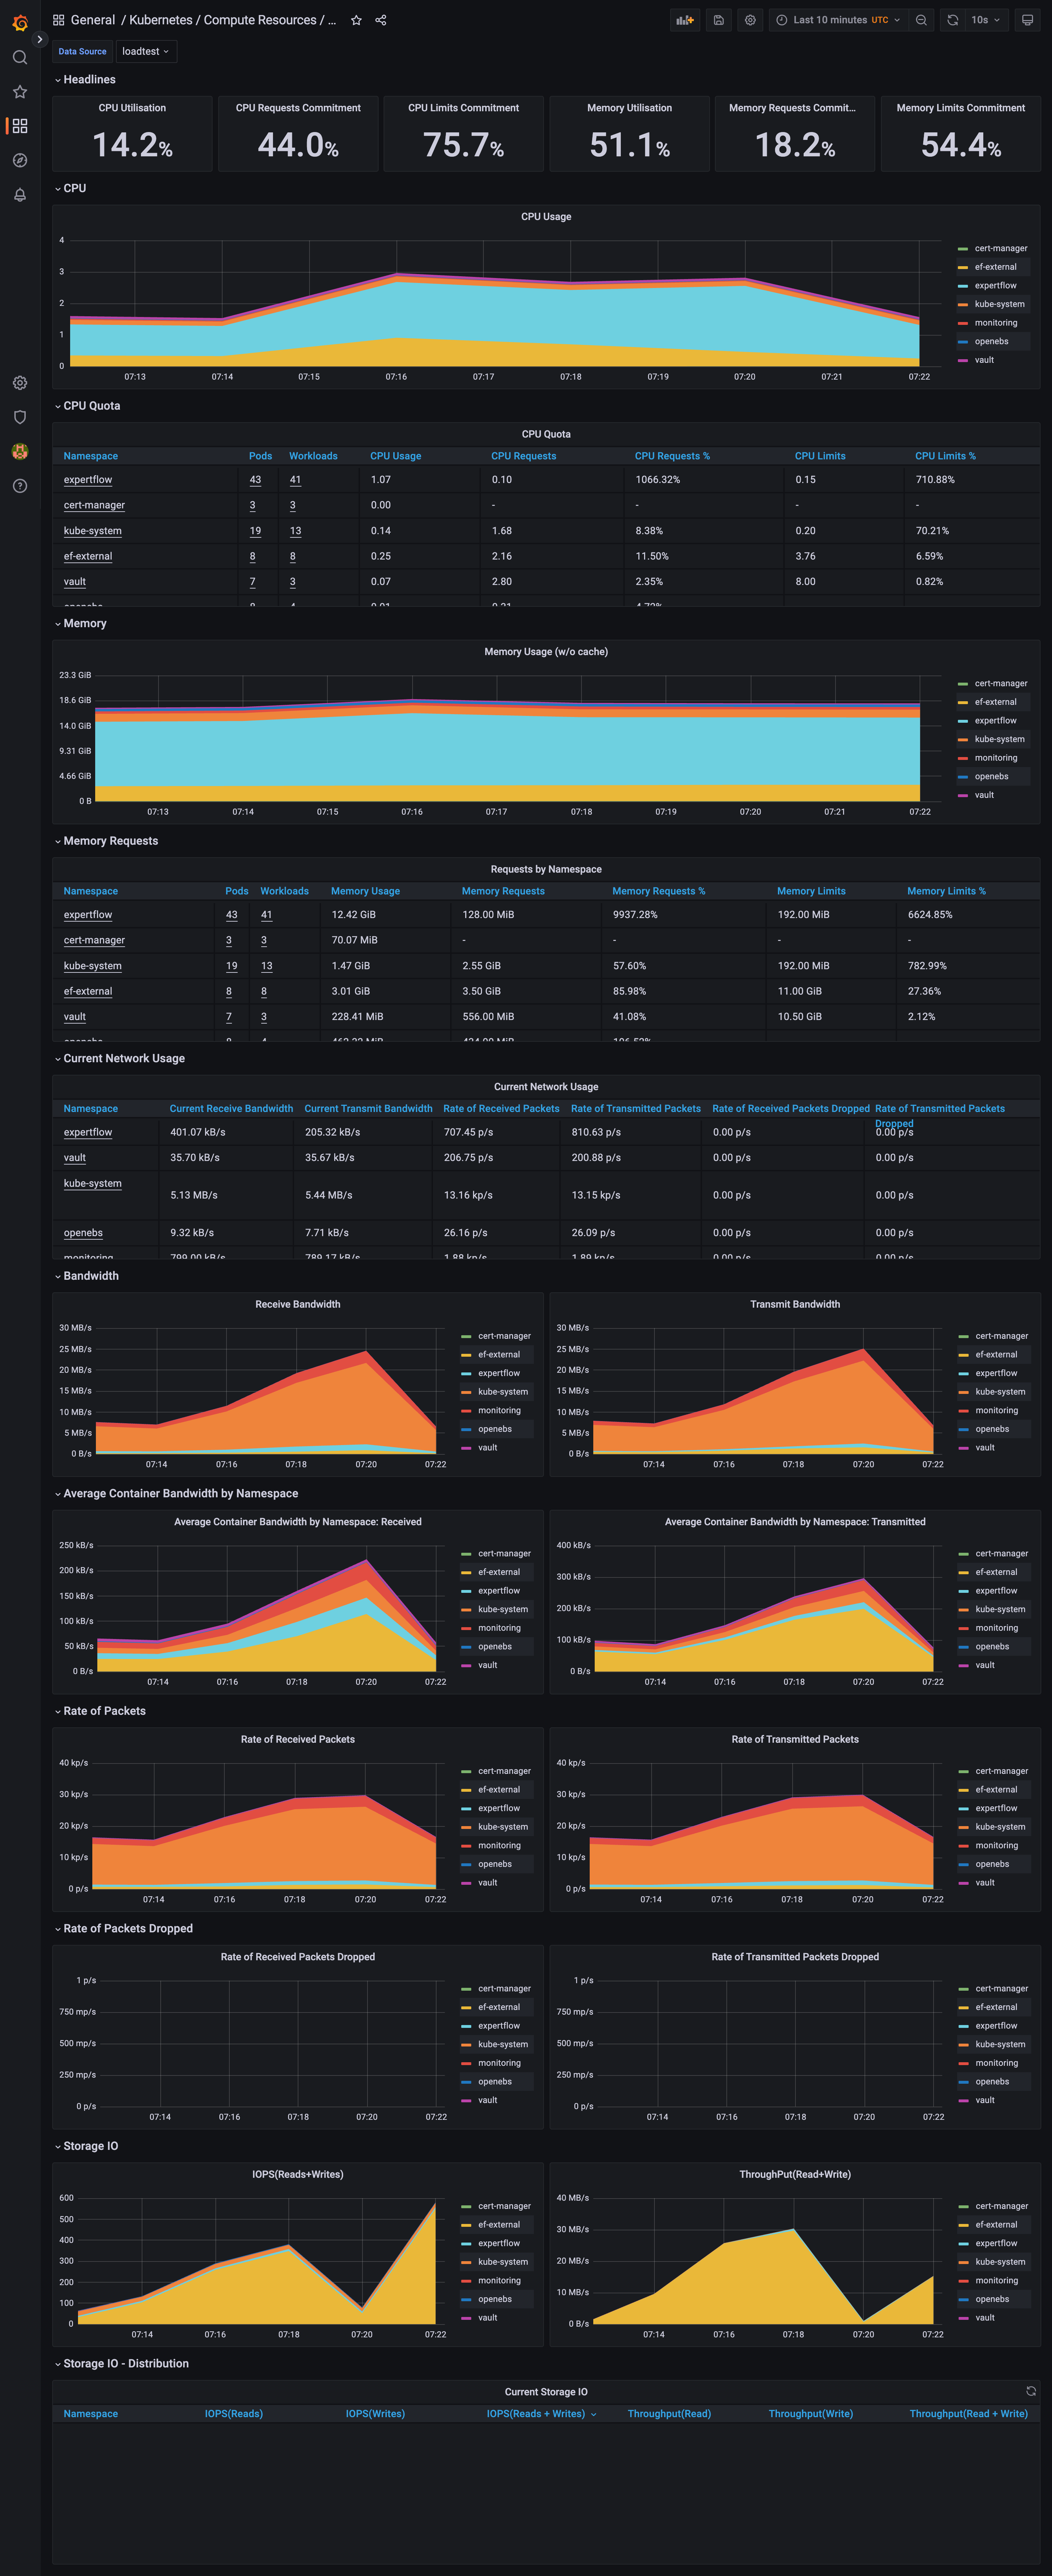
5. Monitoring & Telemetry Visualization
To validate the metrics recorded in this report, the following screenshot provides a real-time view of the monitoring dashboard (e.g., Grafana/Prometheus) during the Load Test window.
-
Metric Overview: The visualization captures the correlation between the 2.9 core CPU spikes and the corresponding increase in memory consumption across the VM1 cluster.
-
Throughput Confirmation: The "Queue Depth" widget confirms the accurate message count, illustrating successful backend processing.
-
Grafana Dashboard: No slowness observed on Grafana Dashboard.