1. Executive Summary
This report details the findings of a performance load test conducted on the core application infrastructure. The objective was to evaluate the stability and resource consumption of the system during high-concurrency scenarios. Key findings indicate a successful handling of message throughput, but revealed a critical CPU bottleneck in the PostgreSQL database layer.
2. Infrastructure & Deployment Map
The application is distributed across two primary virtual environments:
-
VM1 (Core Services): Core Logic, Channels, Campaigns, QM, Reporting, Vault, Transflux, MongoDB, ActiveMQ, Redis, Minio, PostgreSQL, and ClamAV.
-
VM2 (Analytics): Metabase.
3. Performance Metrics
3.1 CPU Utilization (Cores)
|
Component |
Before Test |
During Load |
After Test (Recovery) |
|
Overall System |
~2.000 |
~14.000 – 15.000 |
~2.000 |
|
ActiveMQ |
~0.006 |
~0.750 |
~0.170 |
|
MongoDB |
~0.187 |
~0.600 |
~0.187 |
|
Redis |
~0.037 |
~0.500 |
~0.040 |
|
PostgreSQL |
~0.183 |
LIMIT BREACHED |
N/A |
Critical Alert: PostgreSQL exceeded its configured CPU limits (Limit: 250m / Request: 150m). This resulted in throttled performance during the peak load phase.
3.2 Memory Usage (RAM)
The overall system memory footprint increased by approximately 4 GiB during the test.
|
Component |
Before Test |
During Load |
After Test (Recovery) |
|
Overall System |
~17.0 GiB |
~21.0 GiB |
~19.5 GiB |
|
ActiveMQ |
416 MiB |
1.2 GiB |
1.2 GiB |
|
Redis |
59 MiB |
1.5 GiB |
59 MiB |
|
MongoDB |
603 MiB |
800 MiB |
650 MiB |
|
PostgreSQL |
93 MiB |
200 MiB |
150 MiB |
4. Operational Observations
-
Throughput: The system successfully processed a high volume of traffic, with the total message count decreasing by ~10k, signifying efficient message consumption.
-
Resource Elasticity: Redis demonstrated excellent recovery, returning to baseline immediately.
-
Persistent Footprint: ActiveMQ maintained a memory footprint of 1.2 GiB post-test, suggesting either message persistence in the heap or a need for garbage collection optimization.
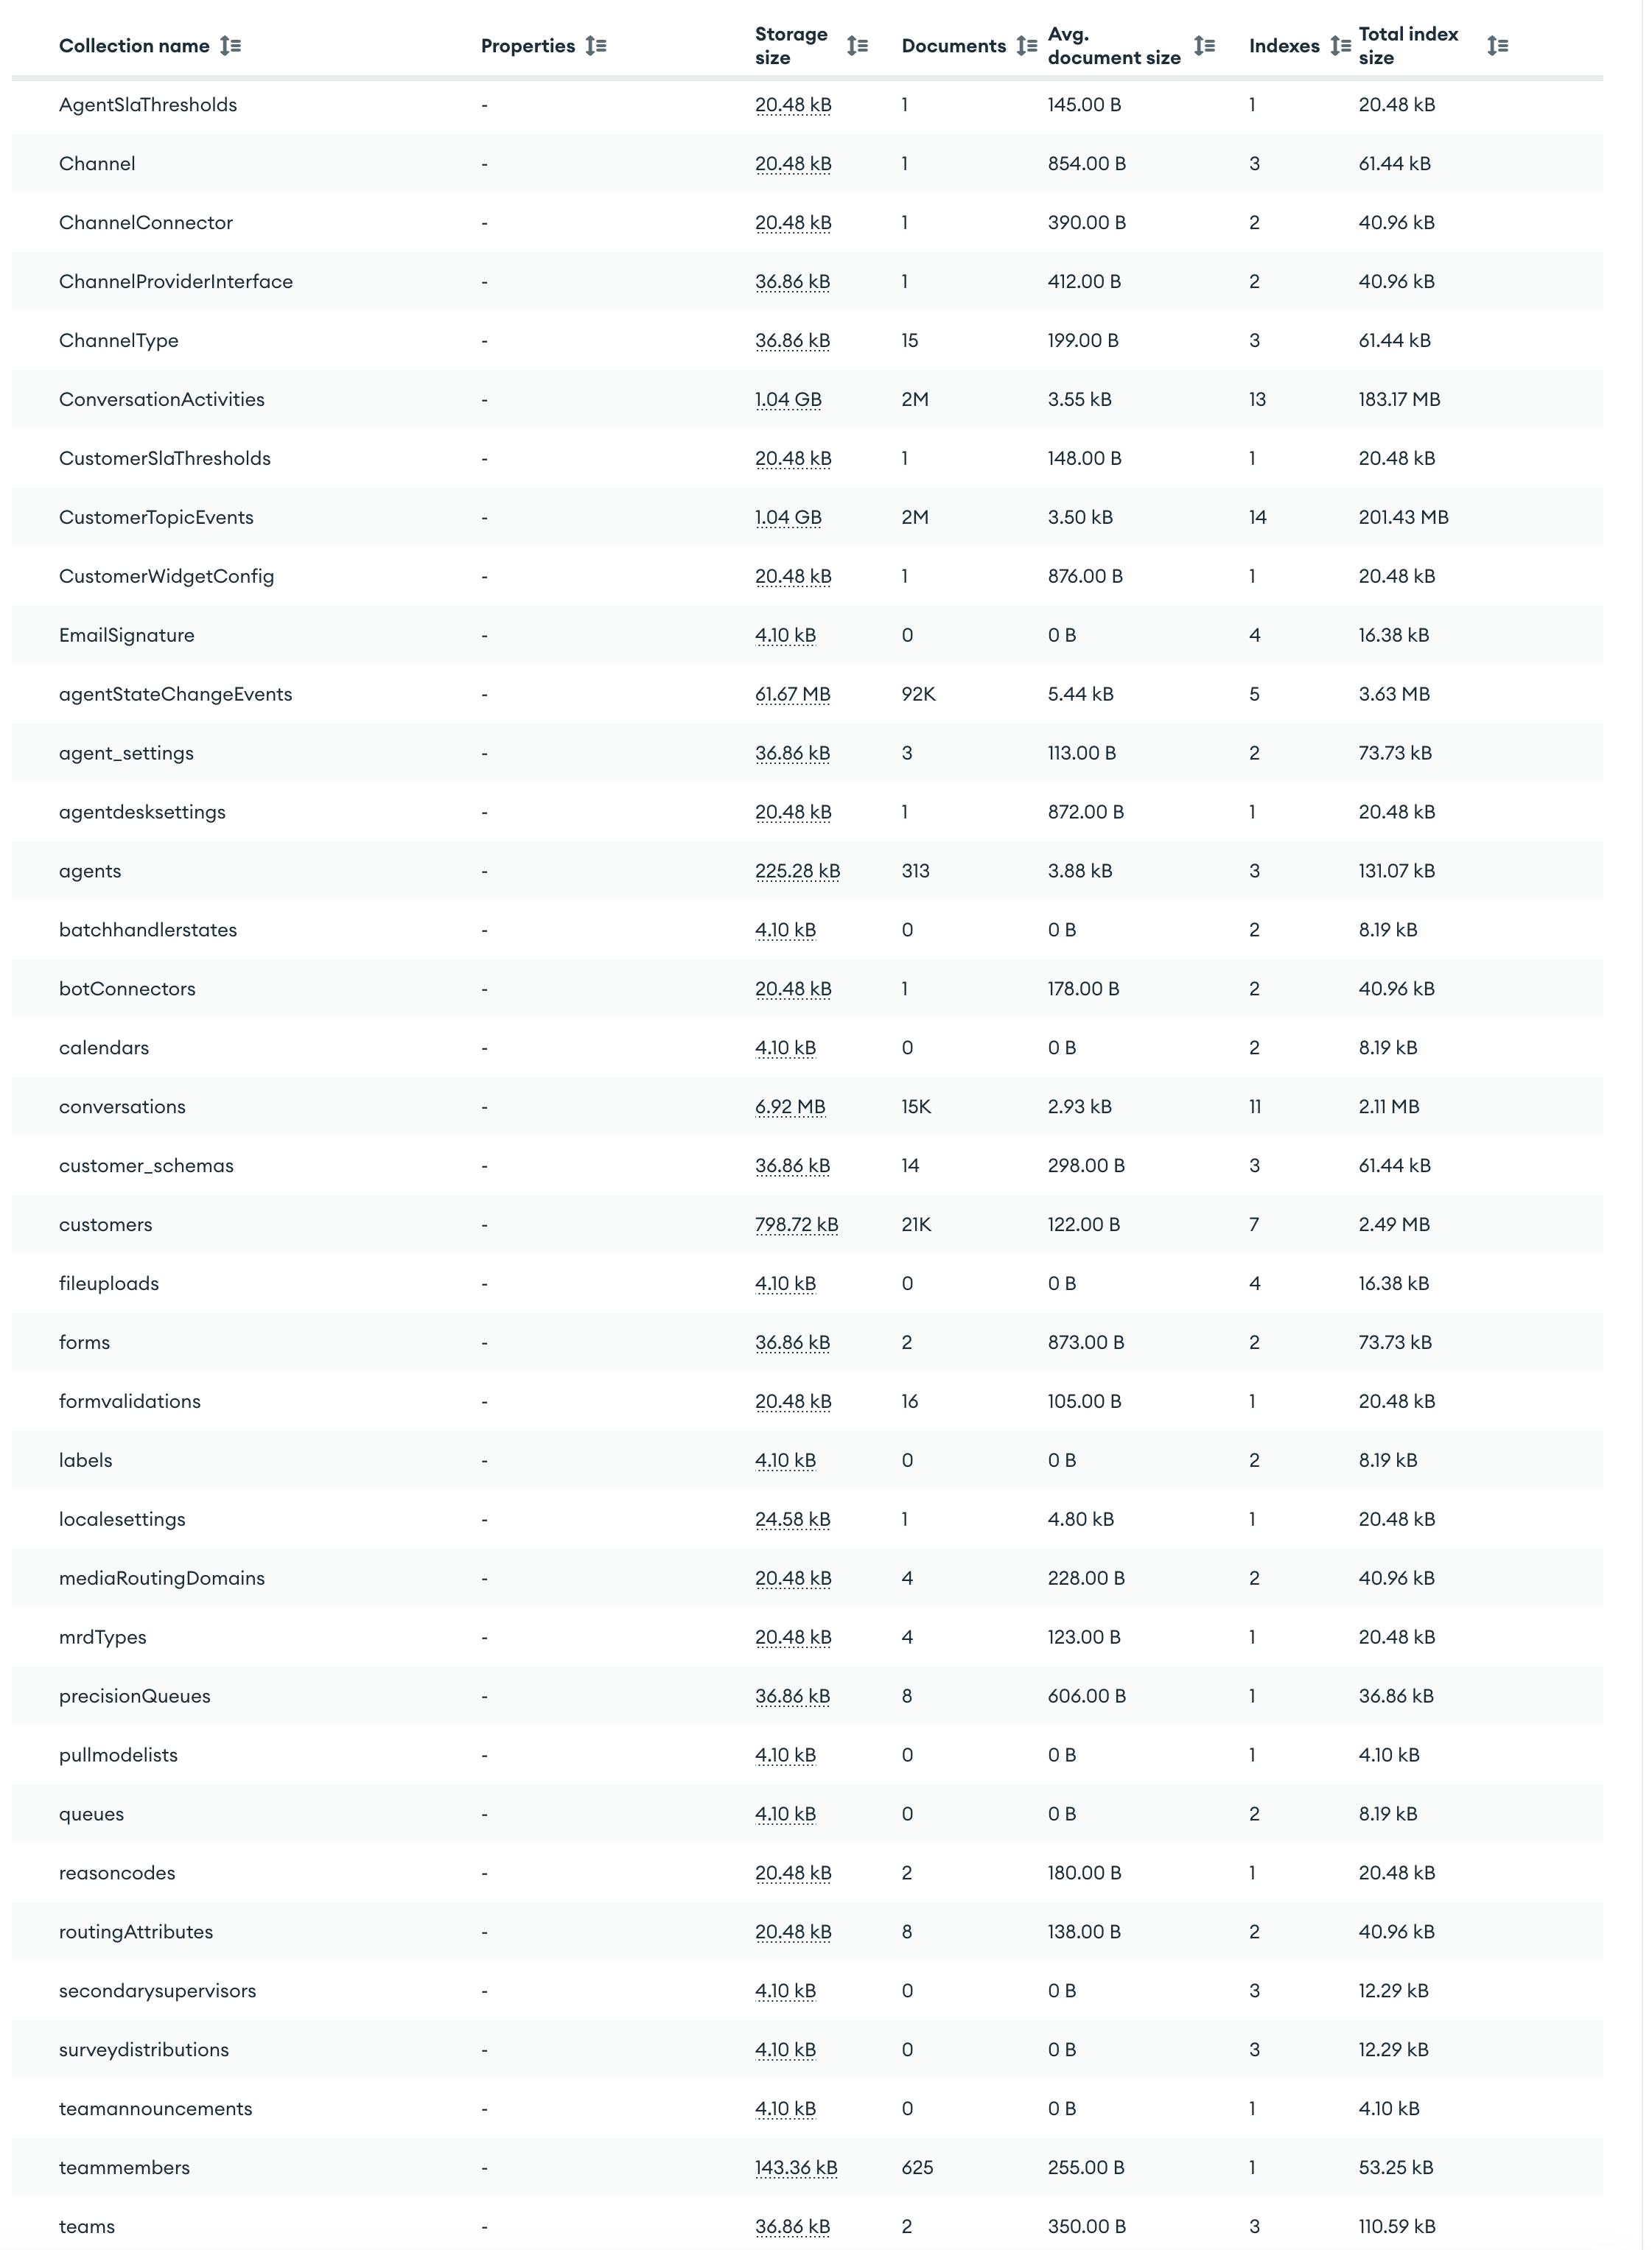
5. MongoDB Collection Storage Estimation
6. Monitoring & Telemetry Visualization
To validate the metrics recorded in this report, the following screenshot provides a real-time view of the monitoring dashboard (e.g., Grafana/Prometheus) during the Load Test window.
-
Metric Overview: The visualization captures the correlation between the 14–15 core CPU spike and the corresponding increase in memory consumption across the VM1 cluster.
-
Threshold Indicators: Note the red highlight on the PostgreSQL chart, indicating where the process reached the 250m CPU limit and began throttling.
-
Throughput Confirmation: The "Queue Depth" widget confirms the 10k message reduction, illustrating successful backend processing.
-
Grafana Dashboard: The slowness observed on the Grafana dashboard.