
Customized Dashboards
Audience: Agents and supervisors
Product: Agent Desk (ExpertFlow contact center)
Build your own live performance dashboards — pick the metrics you care about, choose how they're displayed, and arrange them exactly the way you want.
What is this feature?
The Realtime Dashboard lets you build your own dashboard by manually adding widgets — small cards that show a specific metric (like agent occupancy, queue service level, or bot activity) in the format you choose (a number, a chart, or a table). You can organize widgets across multiple tabs, resize and rearrange them, and set how often they refresh.
This guide covers the manual widget setup flow. The dashboard also offers a "Create with AI" option for generating widgets automatically — that flow is not covered here.
Who can use it?
Any agent or supervisor with access to the Realtime Dashboard menu item can build and manage their own dashboard. Dashboards and widgets you create are personal to your view.
|
Access level |
What you can do |
|---|---|
|
View |
See the Realtime Dashboard and any widgets already on it |
|
Manage |
Add, edit, resize, rearrange, and remove widgets and tabs |
If you don't see Realtime Dashboard in your navigation menu, ask your administrator to enable it for your account.
How to open the feature
-
Click the menu icon in the top-left corner of Agent Desk.
-
Click Dashboard to expand the dashboard menu.
-
Click Realtime Dashboard.
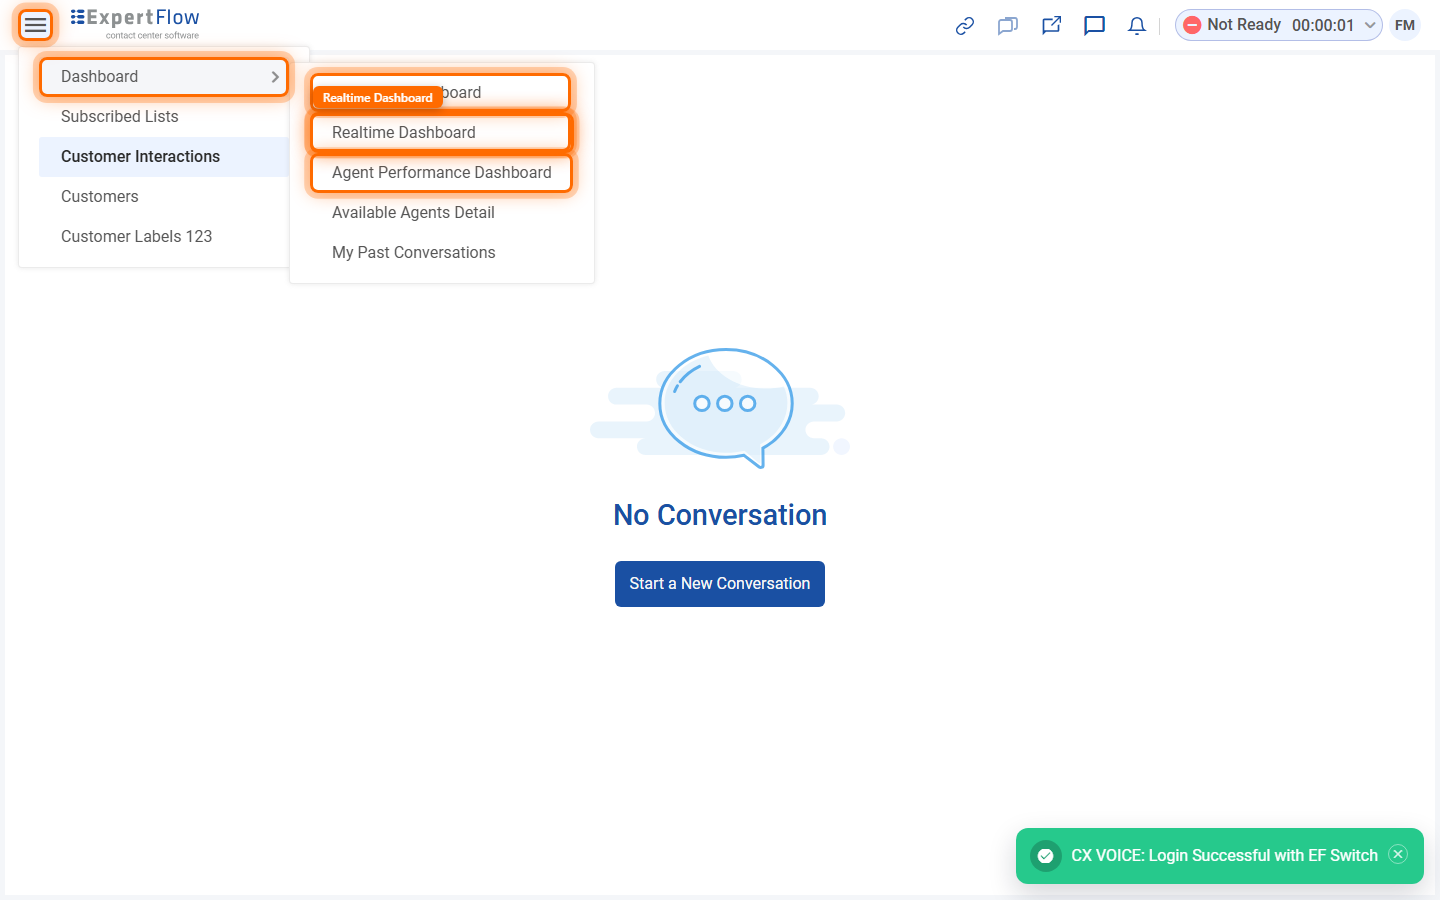
Figure 1 — Navigate to Dashboard > Realtime Dashboard.
When you first open it, your dashboard is empty and offers two ways to get started: Create with AI or Manual Setup. This guide walks through Manual Setup.
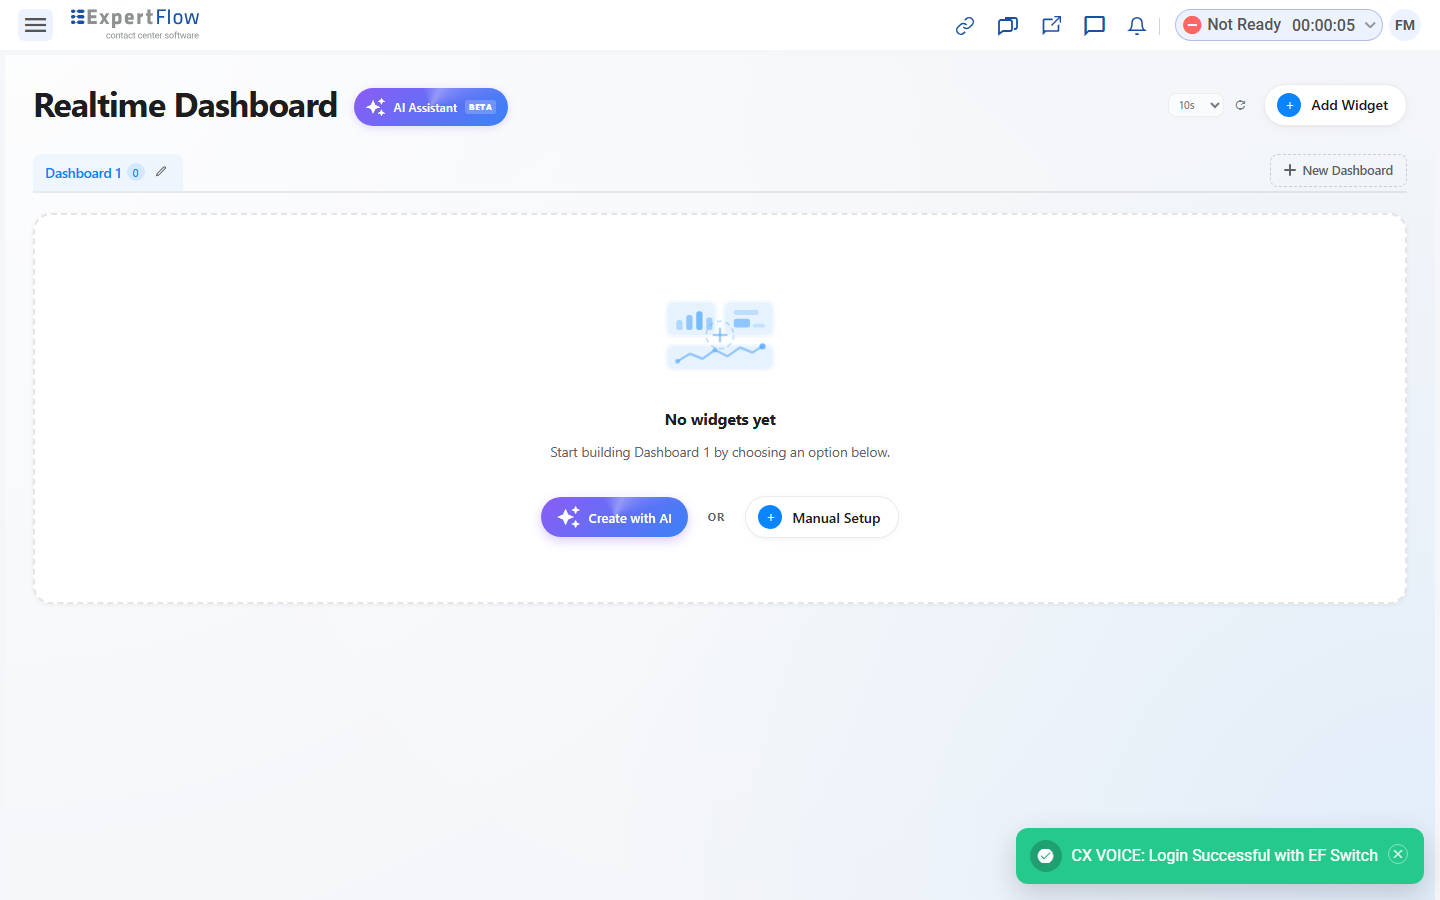
Figure 2 — The Realtime Dashboard before any widgets are added.
Adding a widget manually
Click Add Widget in the top-right corner (or Manual Setup on an empty tab) to open the widget builder. It walks you through four steps.
Step 1 — Choose a category
Pick the area you want to report on: Agents, Channels, Queues, Teams, or Bots. Click a card, then click Next Step.
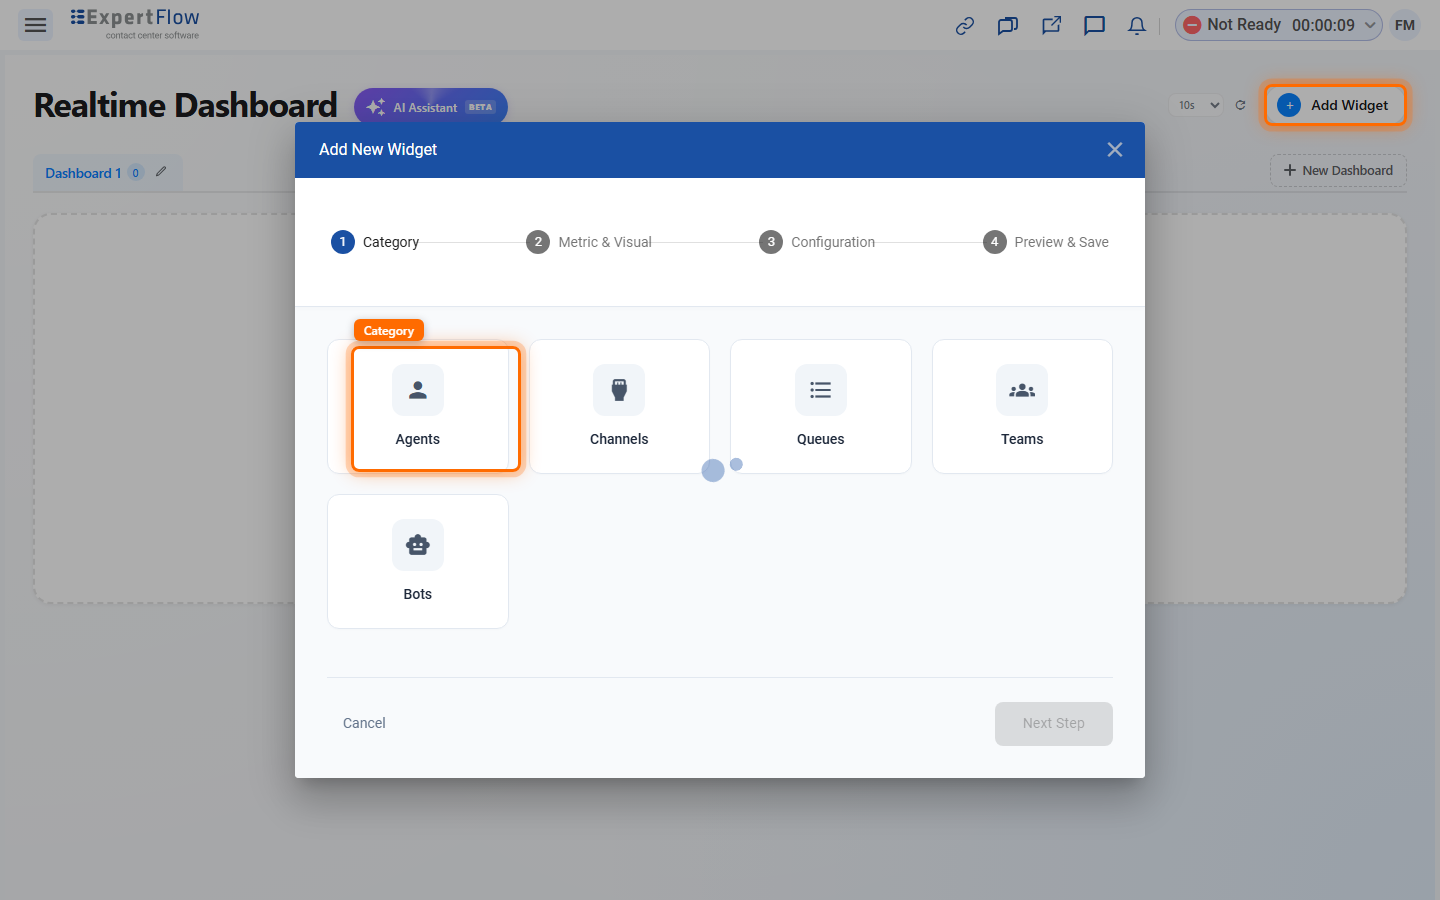
Figure 3 — Step 1 of the widget builder: pick a category.
Step 2 — Choose a metric and visualization
Select the specific metric you want to track from the Select Metric dropdown (options depend on the category you picked). Then choose how it should be displayed — as a KPI number, Bar chart, Pie chart, Line chart, or Table, depending on what that metric supports.
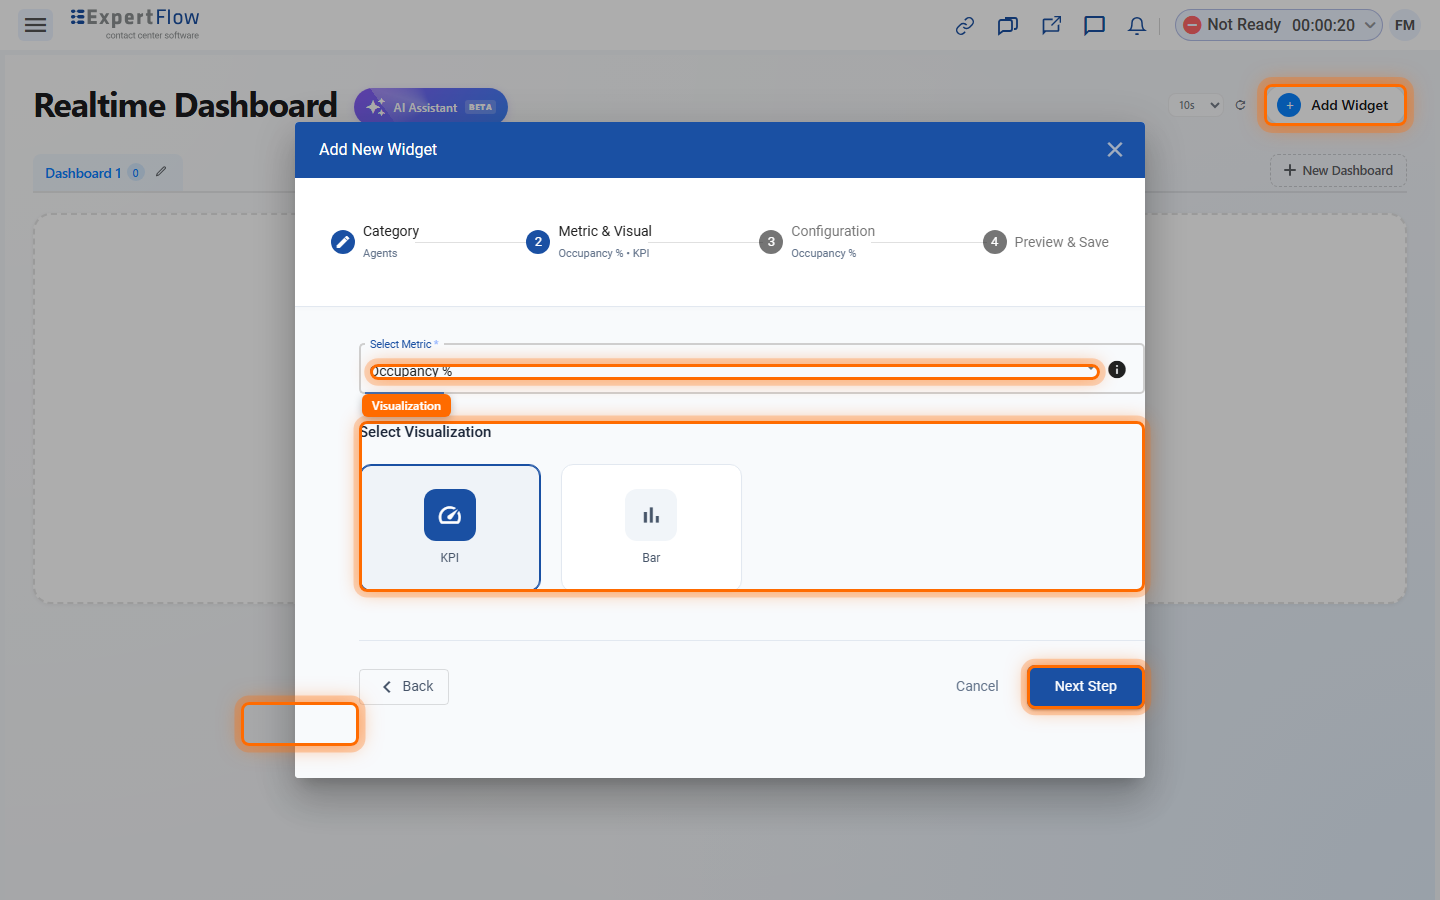
Figure 4 — Step 2: pick a metric and how it should be visualized.
Step 3 — Configure the widget
Give your widget a title (a default is filled in for you). Depending on the metric, you may also need to select a team, queue, channel category, or bot to scope the data.
You can also set up color thresholds here — rules that change a widget's color based on its value (for example, turning red when a queue's wait time crosses a limit). Click Add Rule, choose a comparison (greater than, less than, etc.), enter a value, and pick a color.
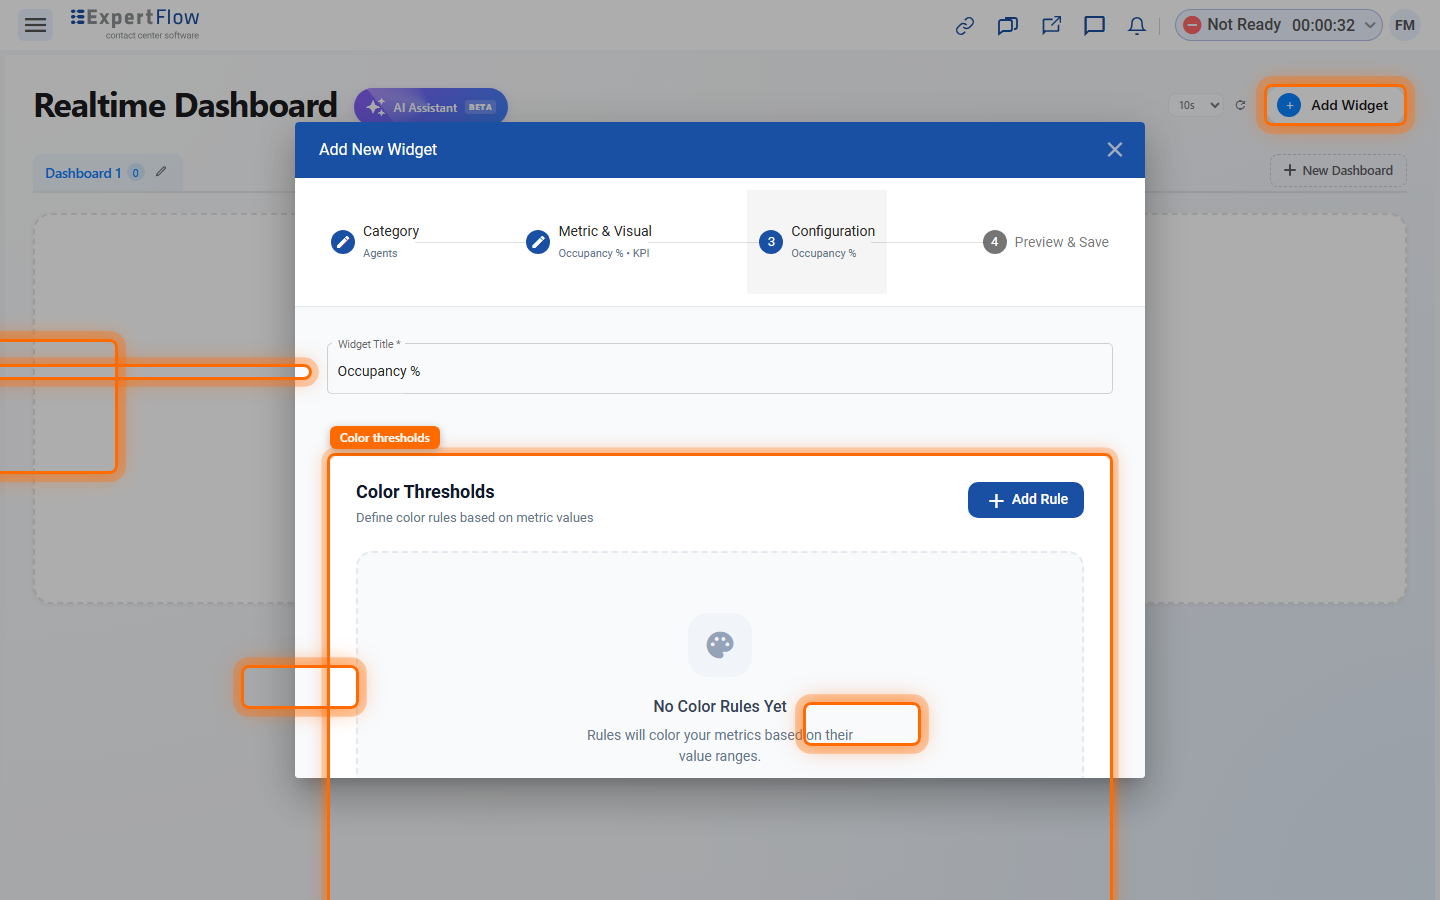
Figure 5 — Step 3: title, filters, and optional color thresholds.
Step 4 — Preview and save
Review how the widget will look, then click Confirm Add Widget (or Save Changes if you're editing an existing widget).
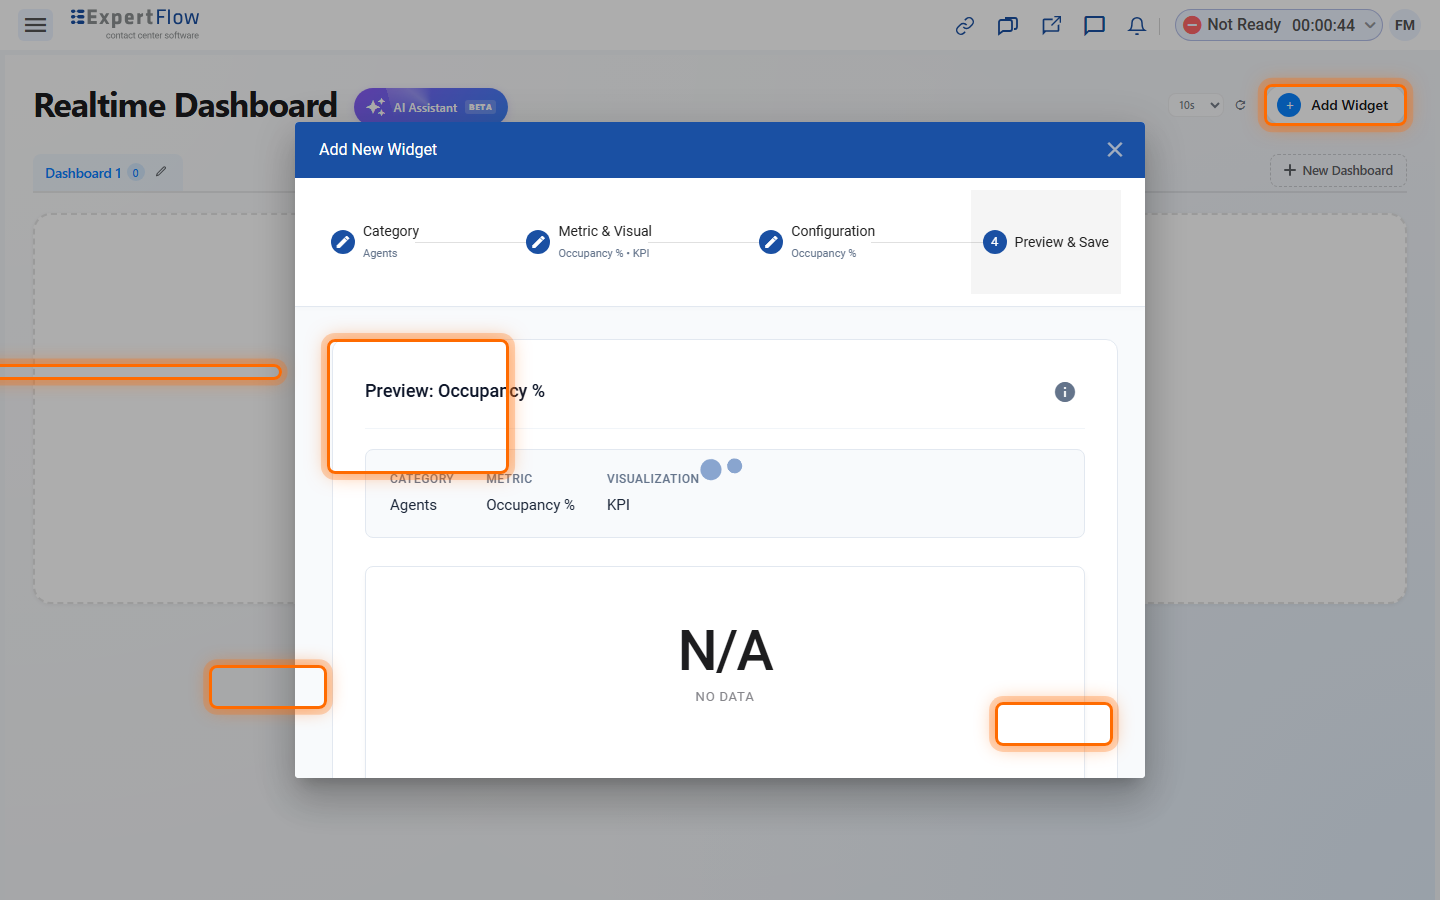
Figure 6 — Step 4: preview the widget before adding it to your dashboard.
Your new widget now appears on the dashboard.
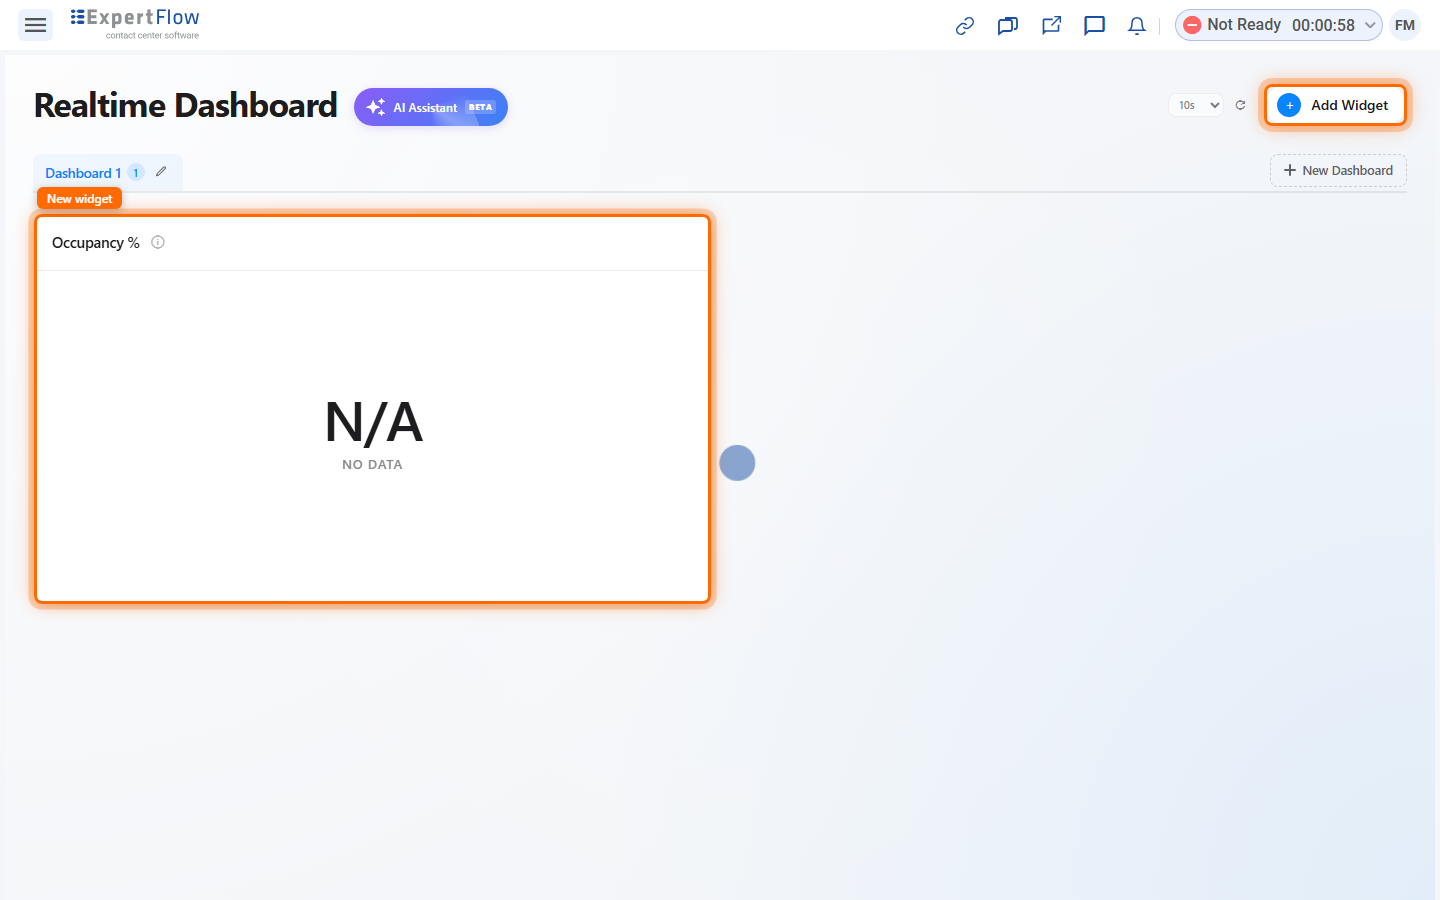
Figure 7 — The widget is added to the active tab.
Managing widgets
Hover over any widget to reveal its action icons in the top-right corner of the card:
-
Edit (pencil icon) — reopens the widget builder on the Configuration step so you can change its metric, title, filters, or thresholds.
-
Remove (X icon) — deletes the widget from the dashboard.
-
Filter (funnel icon, shown only for widgets that support it) — lets you adjust the widget's team, queue, or channel filter without opening the full editor.
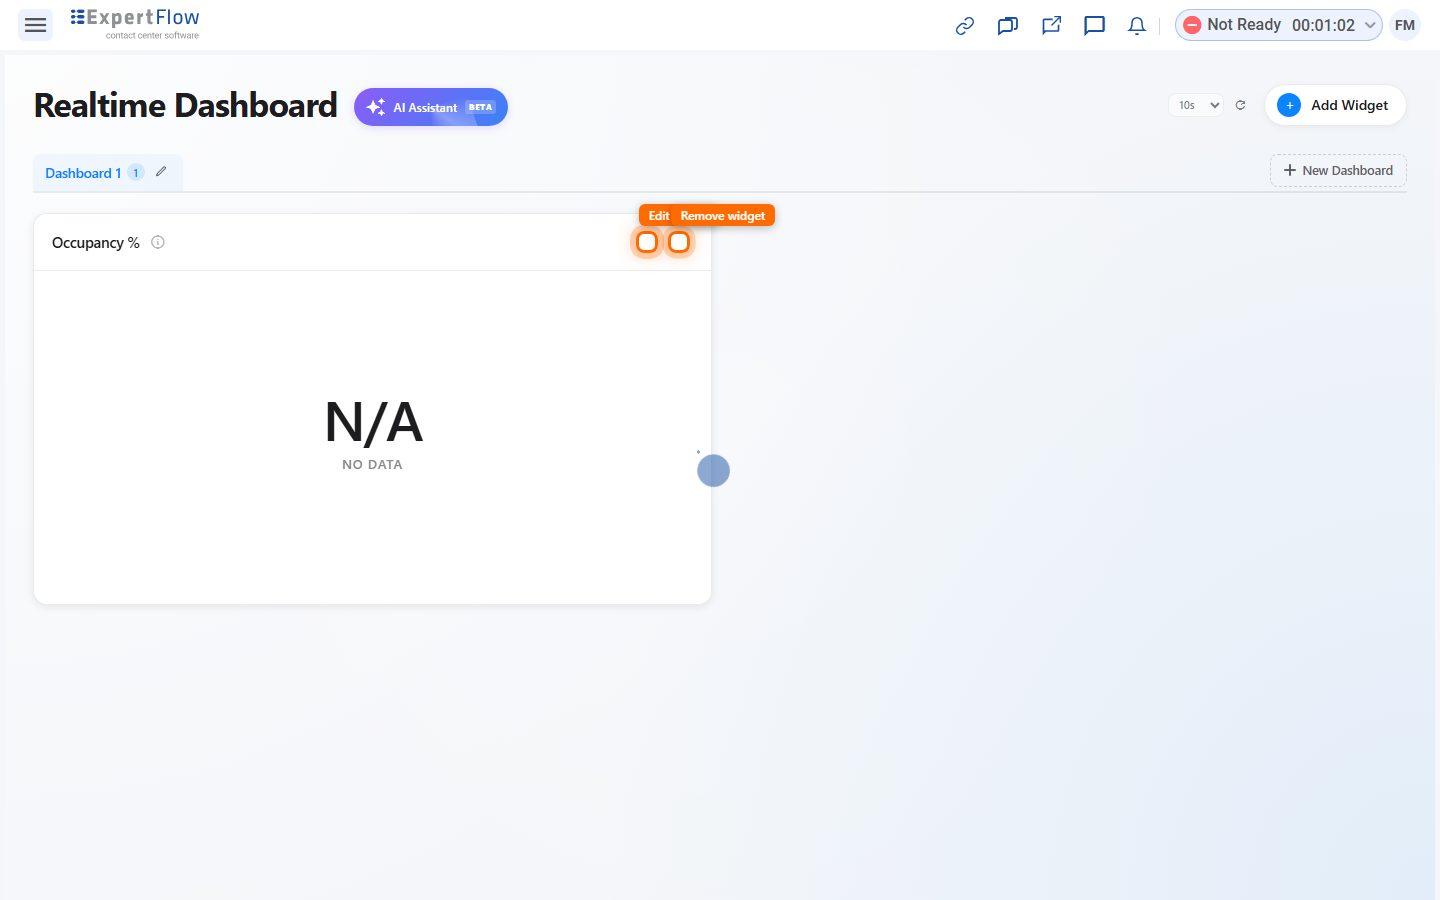
Figure 8 — Widget actions appear when you hover over a widget.
To resize a widget, drag the small handle in its bottom-right corner. To rearrange widgets, drag a widget by its header and drop it in a new position.
Working with tabs
Each dashboard can have multiple tabs, letting you group widgets by topic (for example, one tab for queue health and another for agent performance).
-
Add a tab — click New Dashboard next to the tab bar.
-
Rename a tab — click the pencil icon next to the active tab's name, type the new name, and press Enter (or click away) to save.
-
Remove a tab — click the X next to a tab's name. This option only appears when you have more than one tab.
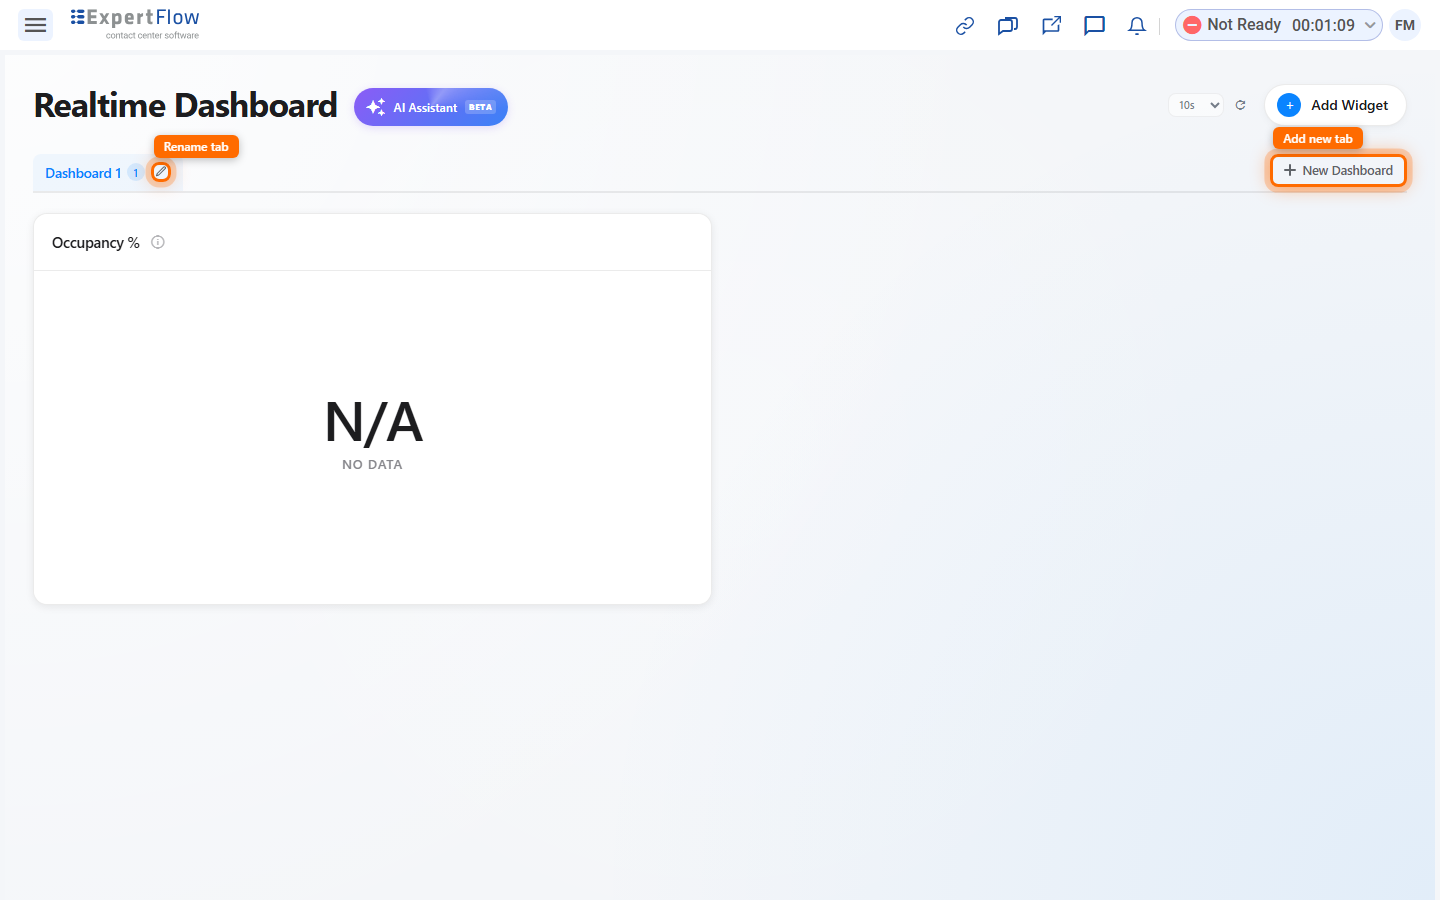
Figure 9 — Managing dashboard tabs.
Refreshing your data
Widgets refresh automatically. You can control this from the top-right of the dashboard:
-
Use the interval dropdown to set how often the active tab refreshes (e.g. every 10 seconds).
-
Click the refresh icon to refresh the active tab immediately, without waiting for the next automatic refresh.
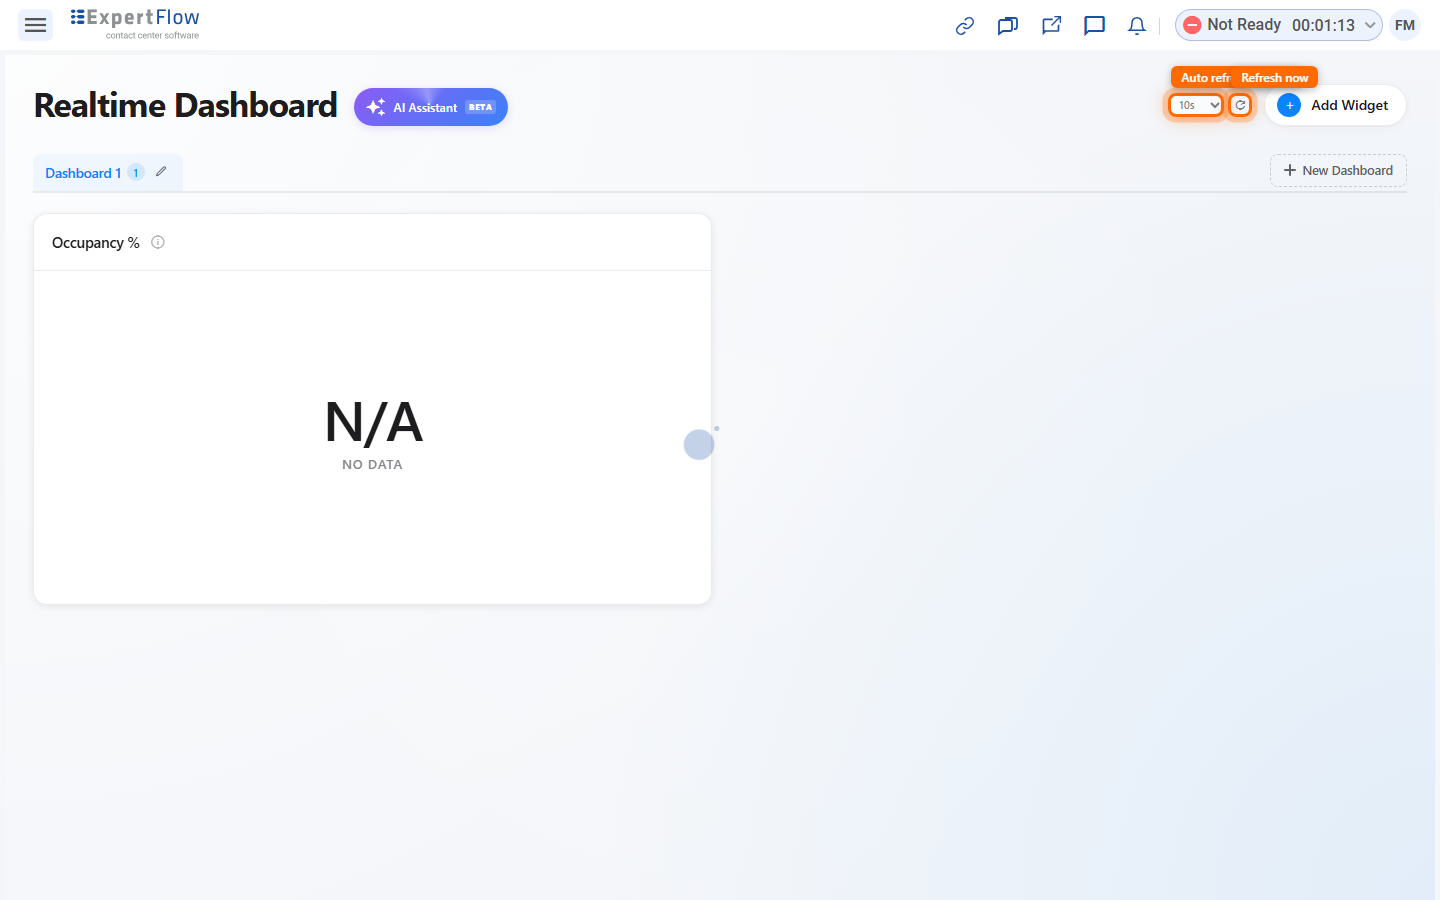
Figure 10 — Auto-refresh interval and manual refresh controls.
Tips
-
Widget titles default to the metric name — rename them to something meaningful if you're tracking the same metric for different teams or queues.
-
Color thresholds are a quick way to spot problems at a glance without reading every number.
-
Not every metric supports every visualization — the builder only shows you the chart types that make sense for what you picked.
Troubleshooting / FAQ
Why is "Next Step" disabled in the widget builder?
You need to complete the required fields on the current step first — for example, some metrics require you to pick a team or queue before you can continue.
Why does my widget show "N/A" or "No Data"?
This usually means there's no data available yet for the filters you selected (for example, an empty queue or an inactive team). Try selecting a different team, queue, or bot, or check back once there's activity to report on.
Can I undo removing a widget?
No — removing a widget is immediate. If you remove one by mistake, just add it again using the same category, metric, and settings.
What's the difference between "Create with AI" and manual setup?
"Create with AI" is a separate, AI-assisted way to generate widgets and is not covered in this guide. This guide covers building widgets yourself, step by step, with full control over the metric, visualization, and filters.
Last updated: 2026-07-21