
After successfully installing CX Campaign and Grafana, the Campaign Studio Dashboard can be accessed through Grafana using the steps below.
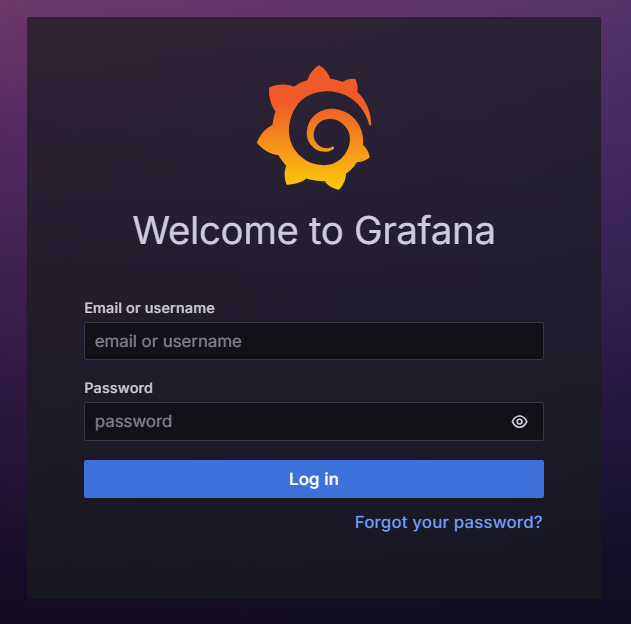
1. Access Grafana
Open your browser and navigate to the following URL:
https://<FQDN>/grafana

2. Sign In to Grafana
Use the provided Grafana credentials:
-
Username / Email:
......@expertflow.com -
Password:
********
3. Configure Prometheus Data Source
The Campaign Studio Dashboard uses Prometheus as its data source.
Ensure that the Prometheus data source is configured correctly in Grafana before accessing the dashboard.
From the Grafana menu, navigate to:
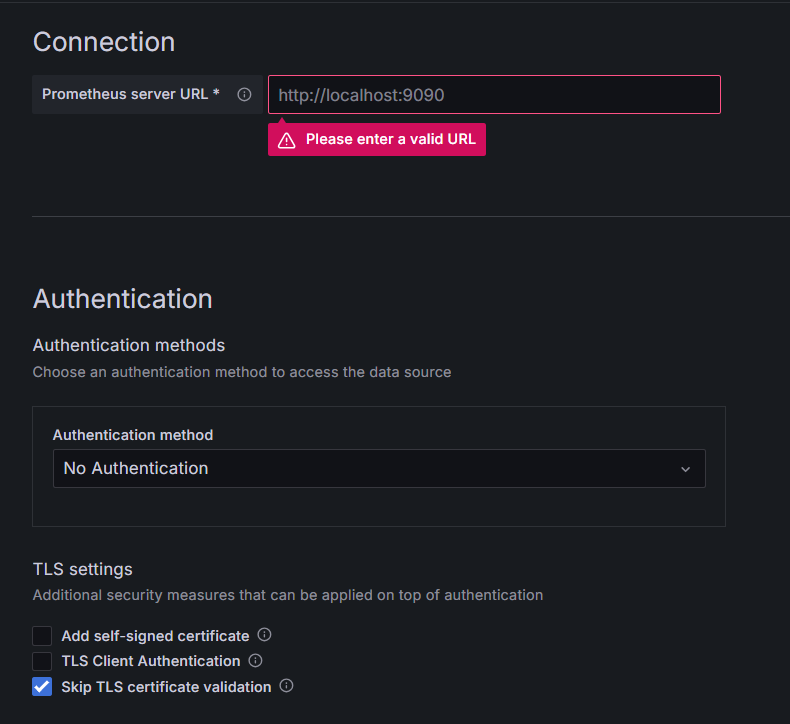
Connections → Data sources
and configure Prometheus as the data source for the dashboard.
Data Source Details
If the Prometheus service is configured as ClusterIP and is not accessible from outside the cluster, change the service type to NodePort to expose it externally.
kubectl patch svc <prometheus-service-name> \
  -n <namespace> \
  --type='json' \
  -p '[{"op":"replace","path":"/spec/type","value":"NodePort"}]'
Verify that a NodePort has been assigned:
kubectl get svc <prometheus-service-name> -n <namespace>
Copy the assigned NodePort value from the output, as it will be required to access Prometheus externally (for example: http://<node-ip>:<nodeport>).
Replace <prometheus-service-name> and <namespace> with the appropriate values for your deployment.
|
Field |
Value / Example |
|---|---|
|
Type |
Prometheus |
|
Name |
Prometheus (or any custom name) |
|
Connection |
Prometheus server URL |
|
|
|
|
|
ℹ️Note Replace |
|
TLS Settings |
Check: Skip TLS certificate validation |
Validate the Connection
After configuring the data source:
-
Click Save & Test
-
Ensure that a success message is displayed, confirming Grafana can connect to Prometheus
4. Open the CIM Dashboard
-
From the Grafana home page
-
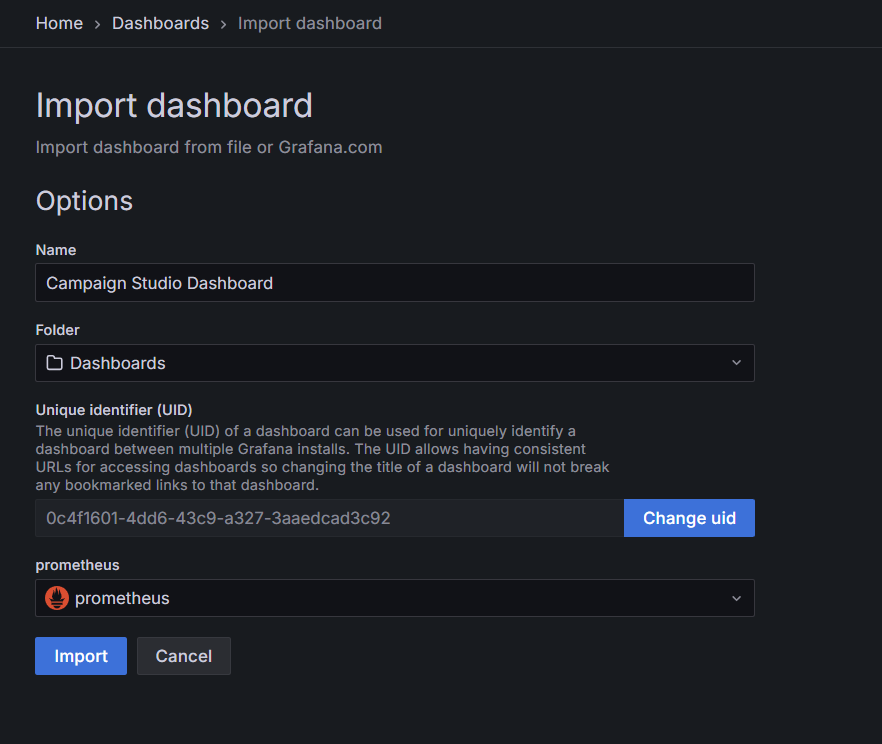
Click New → Import.
-
Upload the dashboard JSON file; Campaign Studio Dashboard-1784291781878.json
-
Select the CIM Dashboard folder.
-
Choose Prometheus as the data source.
-
Click Import.
-
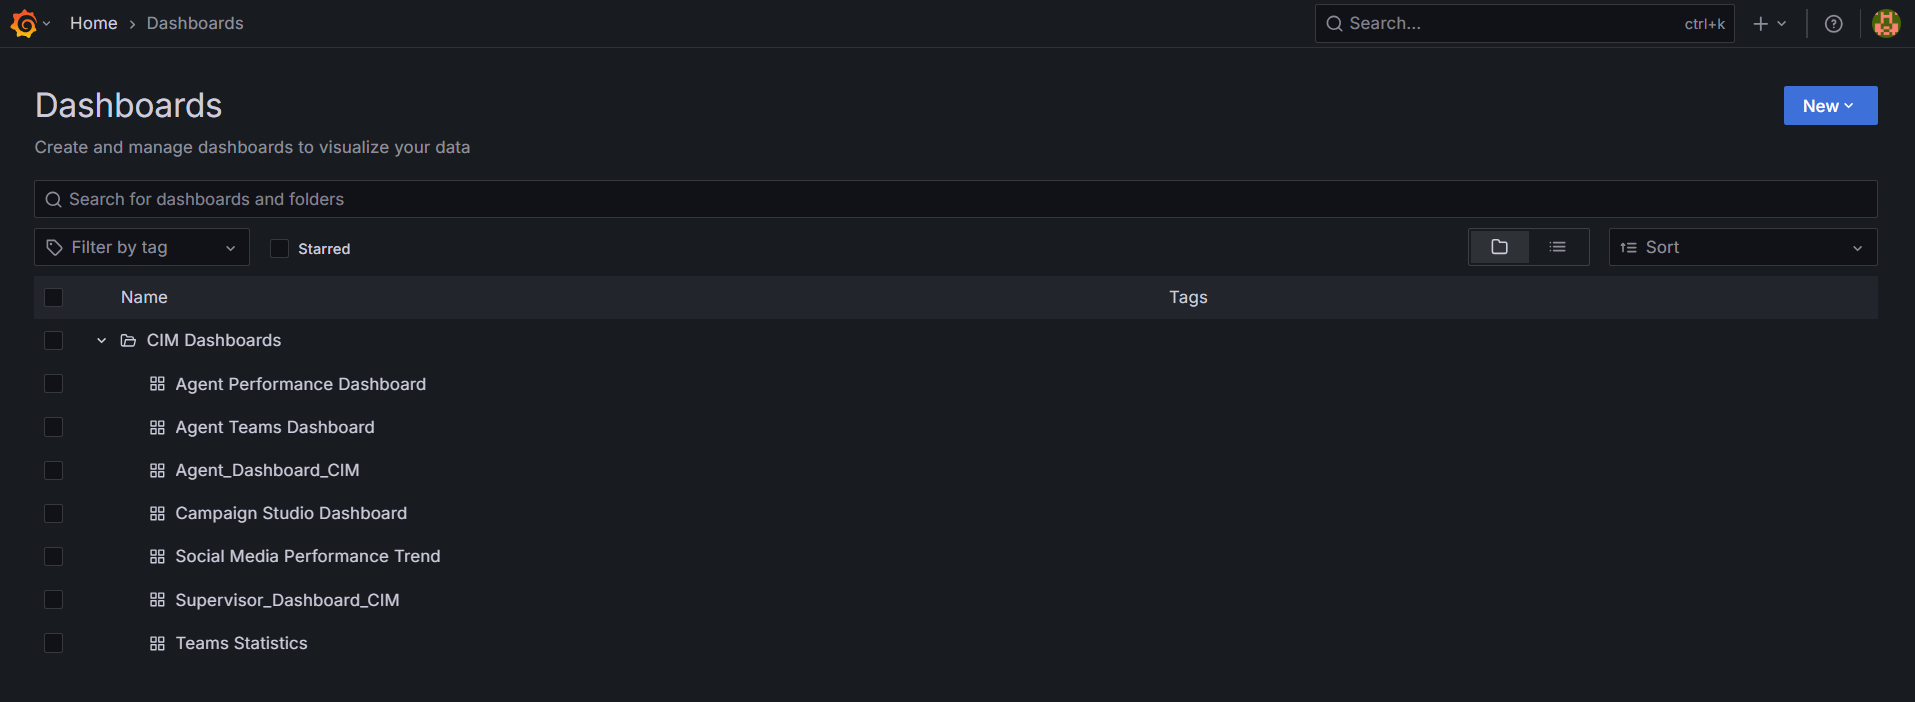
Within the CIM Dashboard, locate the Campaign Studio Dashboard.
-
Click on it to navigate to the Campaign Studio Dashboard view.
5. Using the Campaign Studio Dashboard
The Campaign Studio Dashboard provides interactive visualizations based on the following variables:
Available Variables
-
Channel Type
-
Flow ID
You can select the required values from the available options for each variable.

6. Dashboard Visualization
Once the variables are selected:
-
The dashboard dynamically updates
-
Different campaign states and metrics are visualized based on the selected Channel Type and Flow ID
This allows users to monitor and analyze campaign behavior effectively.