Overview
The Grafana dashboards display both real-time and historical statistics. To support real-time monitoring, the dashboard automatically refreshes every 10 seconds to display the up to date stats in realtime.
However, combining real-time data and historical stats with frequent historical queries can degrade performance, as the system repeatedly runs heavy queries against the database. Additionally, executing direct SQL queries from Grafana introduces a security risk, particularly the potential for SQL injection attacks. Malicious users could exploit this to execute harmful queries on the underlying database through Grafana.
This guide outlines a recommended solution to improve dashboard performance and enhance security by optimizing how historical data is accessed and minimizing direct database exposure.
Challanges faced with the current design
-
Performance: Grafana dashboards refresh every 10 seconds to fetch the latest statistics. However, the historical panels precalculate data from scratch on each refresh. As the number of users increases, this results in heavy load on the database, leading to noticeable performance degradation.
-
Security: Running raw SQL queries directly from Grafana to the database introduces a significant security vulnerability eg SQL Injection attacks. If not properly secured, attackers could exploit this path to inject and execute malicious SQL scripts targeting the historical data.
-
Multitenancy: Supporting multitenancy adds complexity. For each tenant, a separate data source must be configured in Grafana to connect to their respective databases. This approach is not scalable and requires maintaining multiple dashboards, one for each tenant.
Recommended Solution
To address the performance, security, and multitenancy challenges, we propose the following improvements:
-
Introduce an Access Layer to access the Historical Data
Instead of allowing Grafana to query the historical database directly, introduce an intermediate layer—an API interface within the Realtime Reports service—that will serve pre-calculated historical statistics to Grafana. -
Pre-calculate Historical Statistics via ETL Jobs
Schedule ETL jobs to regularly compute and store the necessary historical metrics in advance. This ensures Grafana only retrieves ready-to-use data, significantly reducing the processing burden during dashboard refreshes. -
Implement Caching
Introduce a caching mechanism for historical statistics on the exposed interfaces. This will reduce repeated database access and improve response times, especially under high user load.
Benefits of this approach
-
🔐 Security :
There is no direct access to the historical database from Grafana. All requests for historical statistics go through a secure API interface provided by the Realtime Reports service, reducing the risk of SQL injection and unauthorized data access. -
✅ Multitenancy :
A single set of dashboards can now support multiple tenants, eliminating the need to maintain separate data sources and dashboards for each tenant. This simplifies configuration and improves scalability. -
⚡ Performance :
-
Historical statistics are pre-calculated and stored ahead of time, so dashboards retrieve ready-to-use data instead of running heavy queries on each refresh.
-
With a 10-second refresh interval, the system uses cached historical data, since it doesn’t change in real time. This minimizes database load and improves overall responsiveness, even as user traffic increases.
-
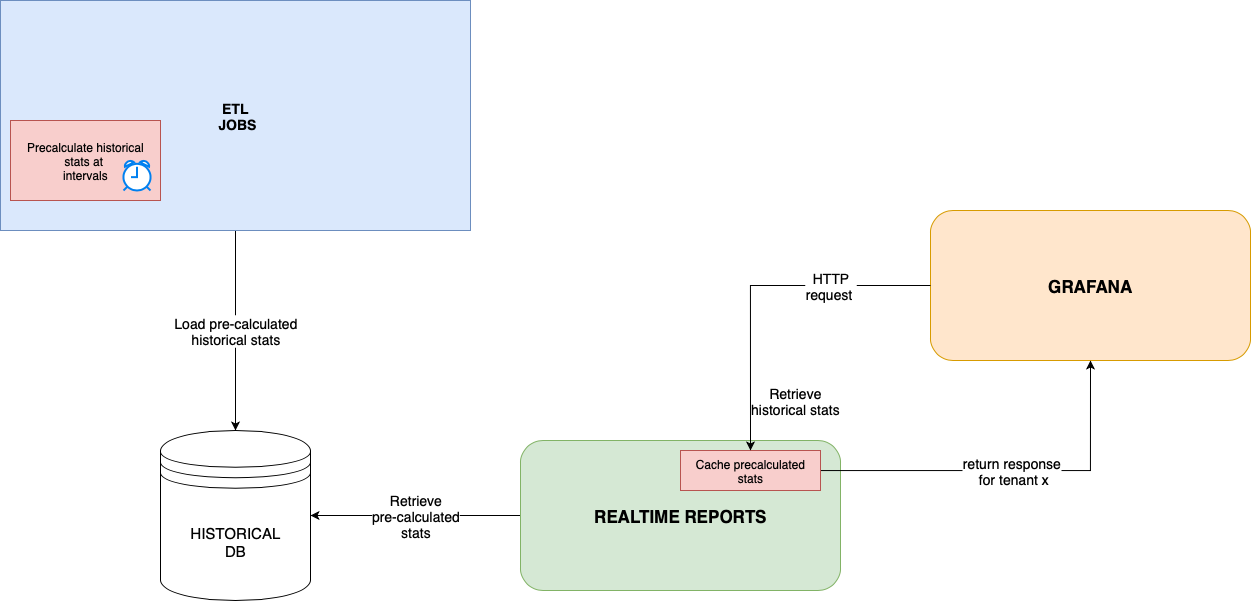
Overview Diagram of the whole flow
Rea