|
Report Summary |
Shows the count of all tasks transferred out from a specific queue in the form of bar chart. |
|---|
Each bar on the chart shows the count of tasks transferred from each queue. This enables the business to see the total counts of all transferred tasks of a particular queue for a particular period of time.
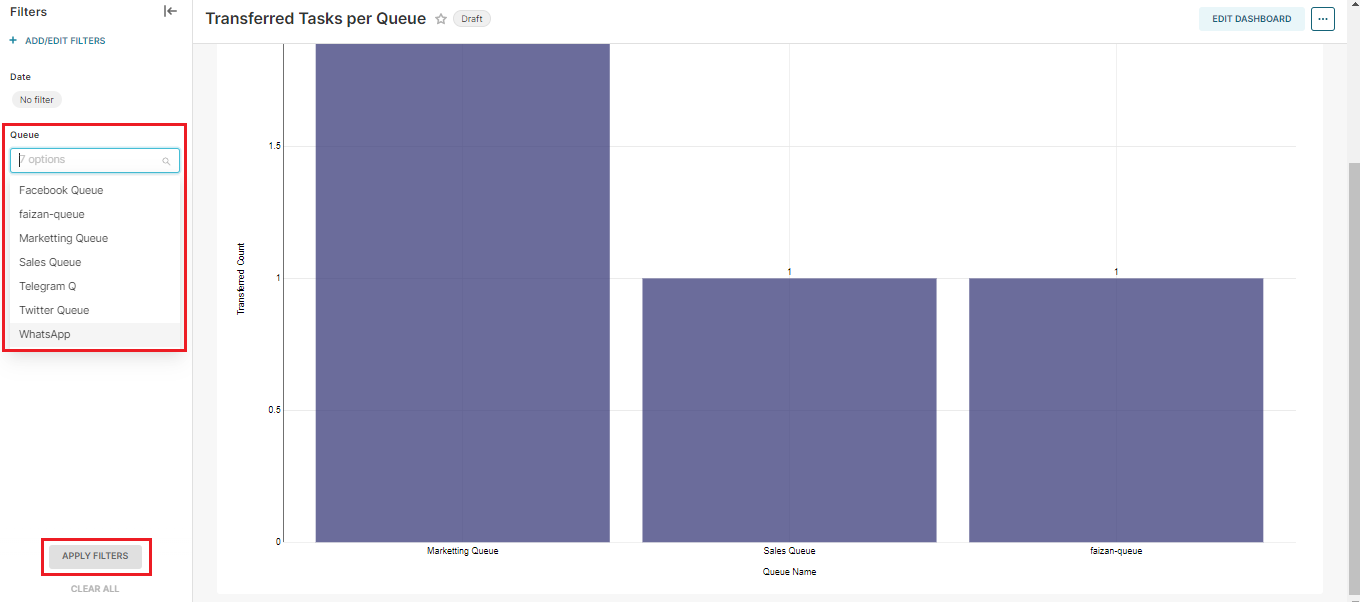
This is not split Date-wise. By default, this bar chart shows all the transferred task data and its count at the top of each bar. Administrators can apply the filters on date and queue as per their requirements.
Report Filters
-
Date/Time: select the date/time for which you want to filter out the data
-
Queue: select any queue you want to see. If no queue is selected, it shows the data of all queues.