|
Summary |
Shows the summary statistics of all conversations being queued, active with agents/bots, and the overall agent states. |
|---|
A supervisor will first select the team they want to monitor out of all the teams that are assigned to them as a supervisor. After selecting a team, the next step is to select a queue from the Queues dropdown. This dropdown shows the list of all queues that are associated with a team. Once selected, the user can select multiple or a single queue(s) to monitor the queue(s) statistics that are part of the selected team.
An agent will only see the Queues dropdown and an available list of queues that you are a part of.
To see the conversations on the dashboard, use the following filters in the sequence:
-
Bot Name - Choose the name of the bot from the dropdown to see the conversations that are currently going on between the customer and the bot
-
Team Name - Choose one team from the dropdown to see the associated queues. The selection here directly affects the queues list being populated in the Queues dropdown so that only the queues that are linked to a team are populated in the dropdown.
-
Queue Name - Based on the Team's selection, the Queues dropdown populates the queue(s) associated with the specified Team. Once the queue(s) is selected, the Conversational statistical data on the dashboard is filtered based on the selected queue(s).
-
MRD Name - Based on the Team's selection, choose one MRD to see the current MRD states of those agents that are part of a team.
Each box on the Summary Dashboard is named as a Panel.
The dashboard contains three rows where related data is grouped under each row.
Those three rows are:
-
Queue Stats
-
Agent States
-
Bot Stats
-
Any changes made to an agent's attributes /adding or removing agent attributes that affect queue associations, will take effect upon the agent's next login, not in real-time on dashboards.
See the following sections to learn more about the panels grouped under each row.
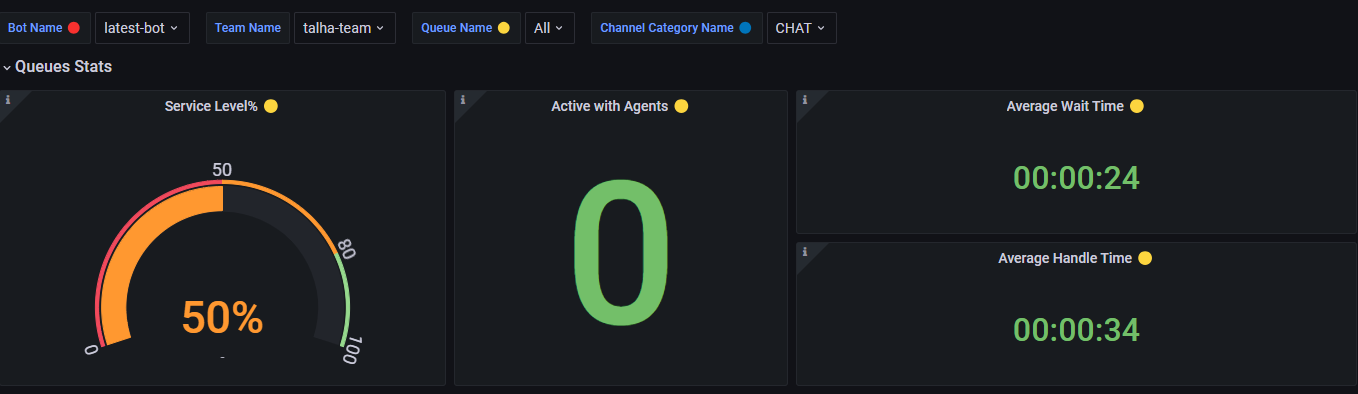
Queue Stats
On the Queues Stats panel, the business can see the following information by selecting one or multiple queues from the Queues checkbox.
|
Panel |
Description |
|---|---|
|
Service Level% |
Shows the Service Level % of the queue(s) based on the Queues filter given on top of the dashboard. This data is retrieved from the historical database which is why, it gets updated after the historical reporting interval. The reporting interval is configurable. By default, it is set to 5 minutes. This is calculated based on the Service Level Type set in the queue definition by the administrator. See Reporting Database Schema -> Key Reporting Concepts to learn more about this parameter. |
Active with Agents
|
Shows some active conversations that are currently active with agents. This data is currently filtered based on the queue(s) that is selected from the queue filter on top of the dashboard, showing the conversations of the queue(s) that are currently active with agents. |
|
Average Wait Time |
This is the average time duration until the request remains in the queue. An average waiting time is calculated by summing all the waiting times and dividing them by the total number of all chats. If for the case when multiple queues are selected, the average wait time will be averaged based on the number of selected queues. This is shown in HH:MM: SS format. |
|
Average Handle Time |
This determines the average handle time of all closed tasks, regardless of any disposition. This duration is calculated as: task_end_time - task_answered_time In case a conversation is joined and handled by multiple agents, the conversation's total handled duration is the sum of the handled durations of all agent tasks (created for each agent who joined the conversation). The average handled duration is calculated as:
If multiple queues are selected, the AHT will be calculated based on the average of the number of selected queues. Format: hours minutes seconds (00:00:00) |
Queue Summary Statistics
This panel lists all queues in a tabular representation with summary statistics of each queue including the total queues and the oldest in the queue. With a queue filter dropdown, select a queue name from the list to filter out the data. You can select one or multiple desired queues to be shown under this panel.
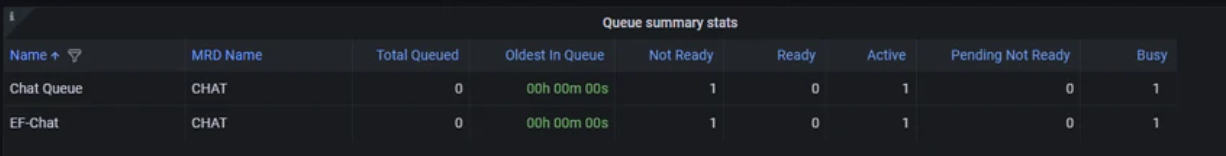
The business can also apply sorting on the queue name to render the queue list in alphabetical order.
|
Queue Name |
This shows the name of the queue. List down all precision queues created in the system, whether or not it has any conversations in the queue. |
|---|---|
|
MRD Name |
The name of the MRD that is associated with each queue by the administrator. |
|
Total Queued |
This is the total number of conversations that are currently queued to this queue |
|
Oldest in Queue |
This is the time duration of about how long a conversation stays in a queue. This time is shown in 00:00:00 format. This is calculated out of all conversations that are currently in the queue, which is the longest waiting conversation. It stays in 00:00:00 if there's no conversation currently in the queue. |
|
Not Ready |
This is the count of agents who are currently in the Not Ready state on this queue. This is determined by the number of agents who are currently Not Ready on the MRD associated with this queue. |
|
Ready |
This is the count of agents who are currently in the Ready state on this queue. This is determined by the number of agents who are currently Ready on the MRD associated with this queue. |
|
Active |
This is the count of agents who are currently in the Active state on this queue. This is determined by the number of agents who are currently Active on the MRD associated with this queue. |
|
Pending Not Ready |
This is the count of agents who are currently in the Pending Not Ready state on this queue. This is determined by the number of agents who are currently Pending Not Ready on the MRD associated with this queue. |
|
Busy |
This is the count of agents who are currently in a Busy state on this queue. This is determined by the number of agents who are currently Busy on the MRD associated with this queue. |
Service level, Average Wait Time, and Average Handle Time data are based on historical data and, therefore, are updated only in the historical reporting interval (aka ETL job interval). The default interval is set to 5 minutes; however, this setting is configurable and can be changed as required by the business.
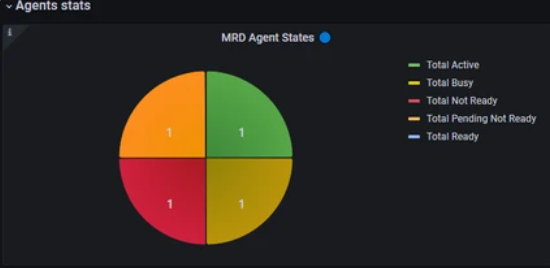
Agent States
This panel shows a pie chart where each slice of the pie shows the count of agents in each MRD state. This data is filtered using the MRDs filter dropdown at the top of the dashboard.
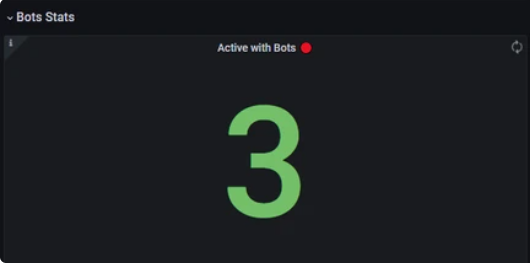
Bot Stats
This panel shows a number of active conversations that are currently active with the bot. This data is filtered using the Bots filter dropdown at the top of the dashboard.
-
Currently, the software only supports having one bot. When multiple bots support will be added in the future, this filter can be used to filter conversations active with a specified bot.
-
A conversation is considered to be active with the bot unless an agent joins it.
Agent Desk Theme Synchronization with Summary Dashboard
-
When a user modifies the theme within any screen of the Agent Desk, the Summary Dashboard will automatically reflect the same theme upon being opened.
-
If a user modifies the Agent Desk theme while on the Summary Dashboard screen, the dashboard will automatically reload to display the updated theme.
-
If a user logs out of the Agent Desk while using the dark theme setting, the dark theme will be applied to both the Summary Dashboard and the Agent Desk upon subsequent logins.